Fig. 2.
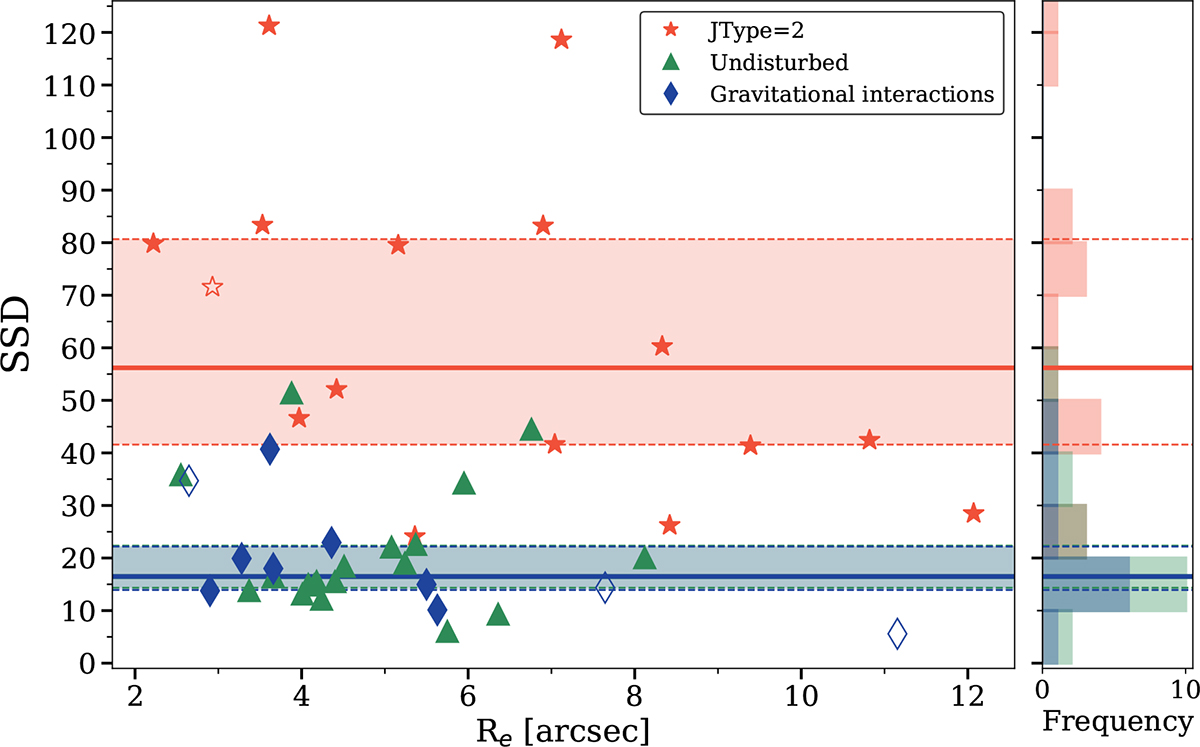
Download original image
Distribution of Re-normalized SSD values as a function of Re for JType = 2 (red stars), undisturbed (green triangles), and gravitationally interacting (blue diamonds) galaxies. Empty symbols indicate galaxies for which Re was estimated using the empirical Re − M★ relation from Franchetto et al. (2020). Solid lines represent the median SSD values for each galaxy type, while the shaded regions correspond to the interquartile range (25%–75%). Dashed lines indicate 25% and 75% of each galaxy type. The SSD value distributions, along with their medians and interquartile ranges, are also shown in the histogram on the right-hand panel.
Current usage metrics show cumulative count of Article Views (full-text article views including HTML views, PDF and ePub downloads, according to the available data) and Abstracts Views on Vision4Press platform.
Data correspond to usage on the plateform after 2015. The current usage metrics is available 48-96 hours after online publication and is updated daily on week days.
Initial download of the metrics may take a while.