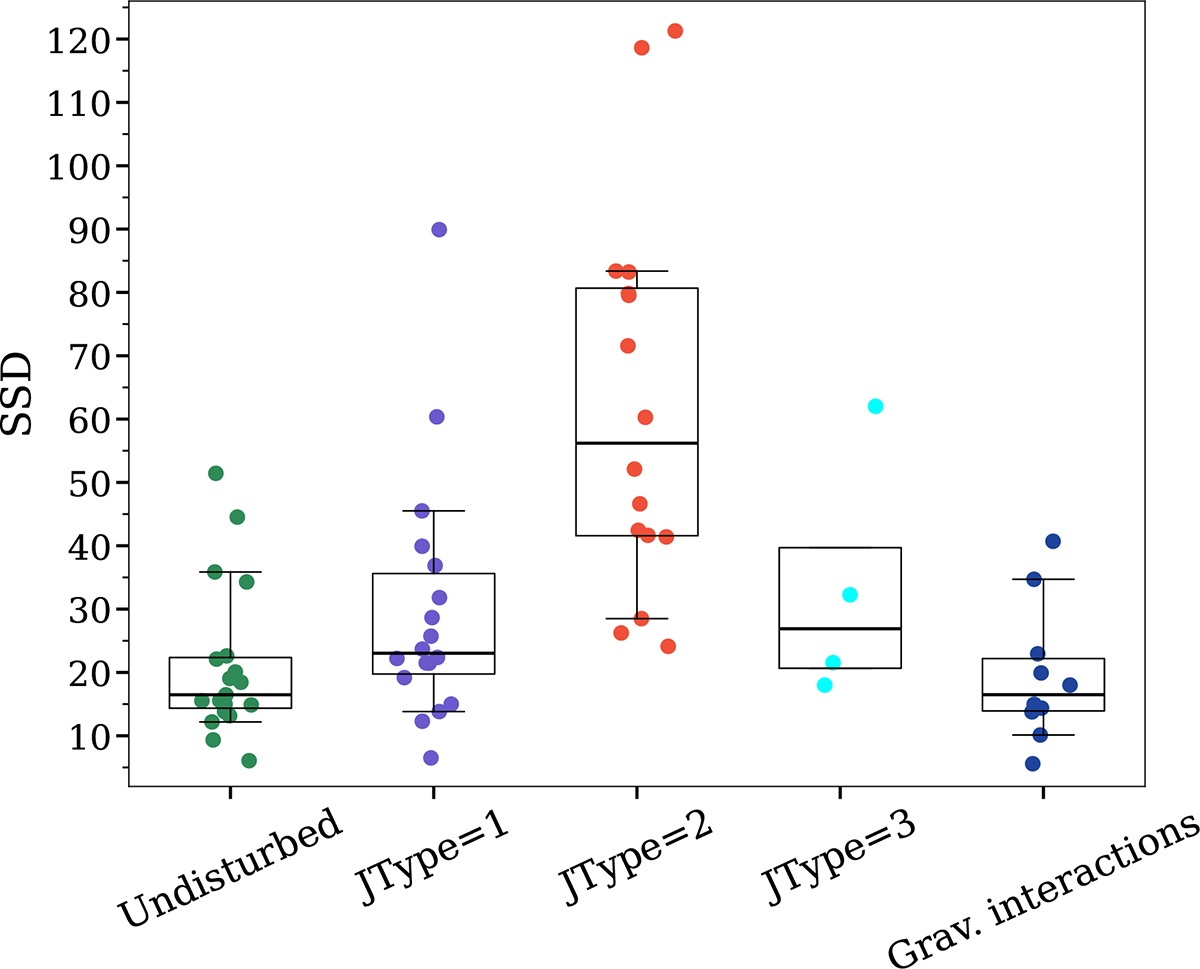
Fig. 3.
Download original image
Boxplot showing the normalized distribution of SSD values for undisturbed galaxies (green), JType = 1 (purple), JType = 2 (red), JType = 3 (cyan) and gravitationally interacting galaxies (blue). Each point corresponds to the SSD measure of an individual galaxy. A minor shift was applied in the x axis for clarity. The box sizes represent the interquartile range (25%–75%) for each galaxy type, while the whiskers indicate the 10%–90% range of each distribution.
Current usage metrics show cumulative count of Article Views (full-text article views including HTML views, PDF and ePub downloads, according to the available data) and Abstracts Views on Vision4Press platform.
Data correspond to usage on the plateform after 2015. The current usage metrics is available 48-96 hours after online publication and is updated daily on week days.
Initial download of the metrics may take a while.