Fig. 10.
Download original image
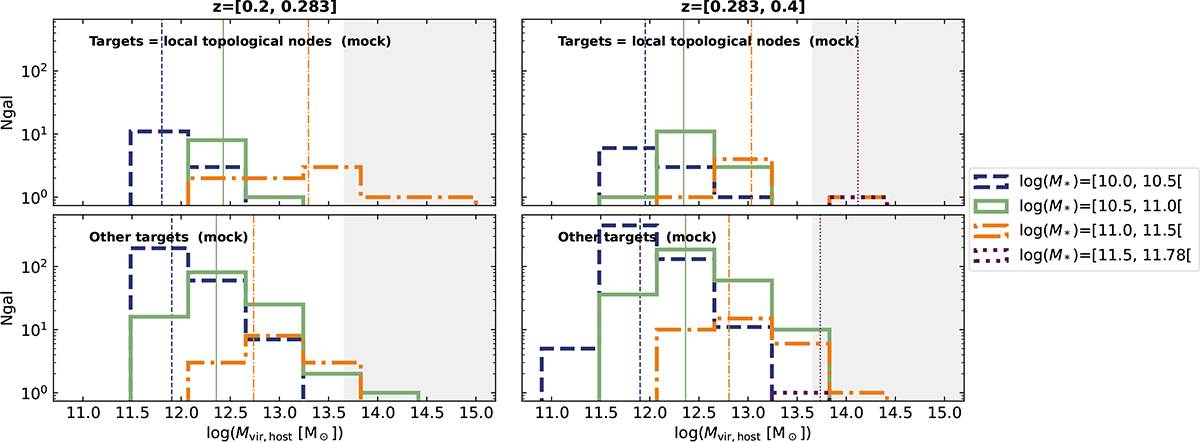
Halo mass distributions of the mock target galaxies, in the same redshift range as in the observations (different columns). The top panels focus on target galaxies that have been identified as local topological nodes of their field (see Sect. 6.1), while bottom panels show the distributions for the remaining targets, i.e. those who are not local nodes. The different colours represent different bins of stellar mass. Vertical thin lines show the median values of the distributions. The gray shaded area show the mass range of typical large-scale cosmic nodes (e.g. hosting galaxy clusters), taken from of Galárraga-Espinosa et al. (2024).
Current usage metrics show cumulative count of Article Views (full-text article views including HTML views, PDF and ePub downloads, according to the available data) and Abstracts Views on Vision4Press platform.
Data correspond to usage on the plateform after 2015. The current usage metrics is available 48-96 hours after online publication and is updated daily on week days.
Initial download of the metrics may take a while.