Fig. 4.
Download original image
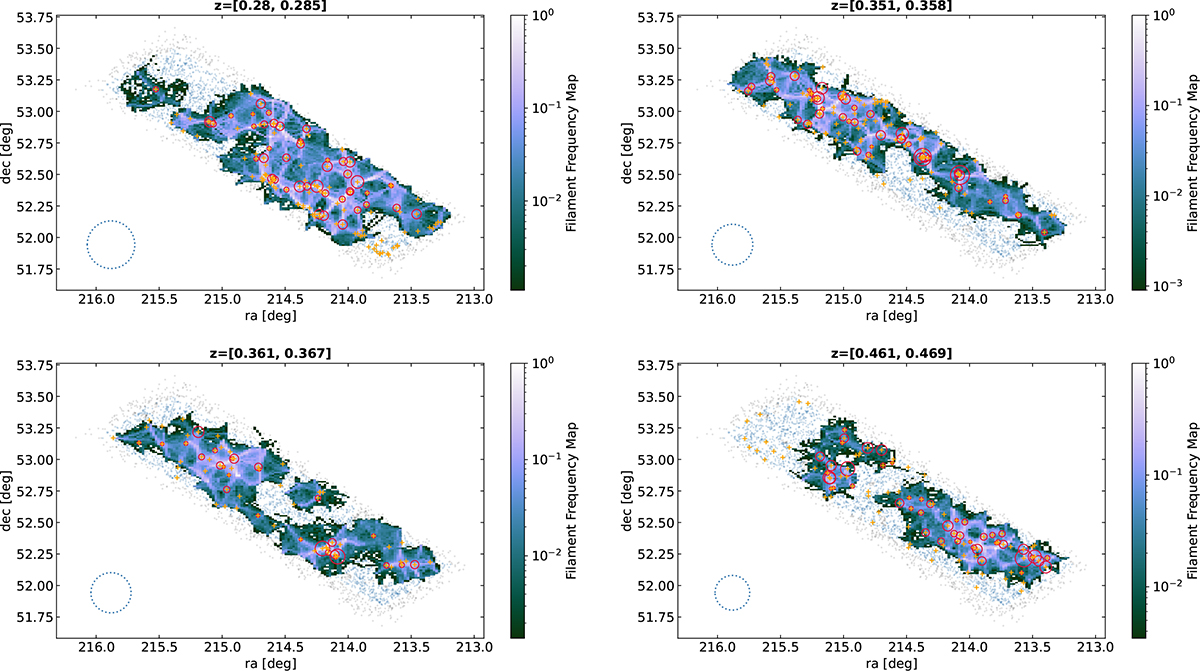
Filament frequency maps measured in our JPAS+DESI galaxy catalogue. Each panel corresponds to the projection of our data in a different redshift slice, each of equivalent thickness 12 pMpc (arbitrary choice, just for visualisation). Red circles show the target galaxies with sizes proportional to their stellar masses (Sect. 2.4). Orange points correspond to tracer galaxies from a single realisation. Pixel colours indicate the number of filament detections (or hits) normalised by the maximum number of hits within the slice (Sect. 4.3). The dotted blue circle in the bottom left corner of the plots shows a scale of radius 3 pMpc measured at the mean redshift of the slice. Blue points in the background show the ∼1, deg2 footprint of the miniJPAS survey and gray points denote the artificial buffer region added at the survey edges, following Sect. 2.1.
Current usage metrics show cumulative count of Article Views (full-text article views including HTML views, PDF and ePub downloads, according to the available data) and Abstracts Views on Vision4Press platform.
Data correspond to usage on the plateform after 2015. The current usage metrics is available 48-96 hours after online publication and is updated daily on week days.
Initial download of the metrics may take a while.