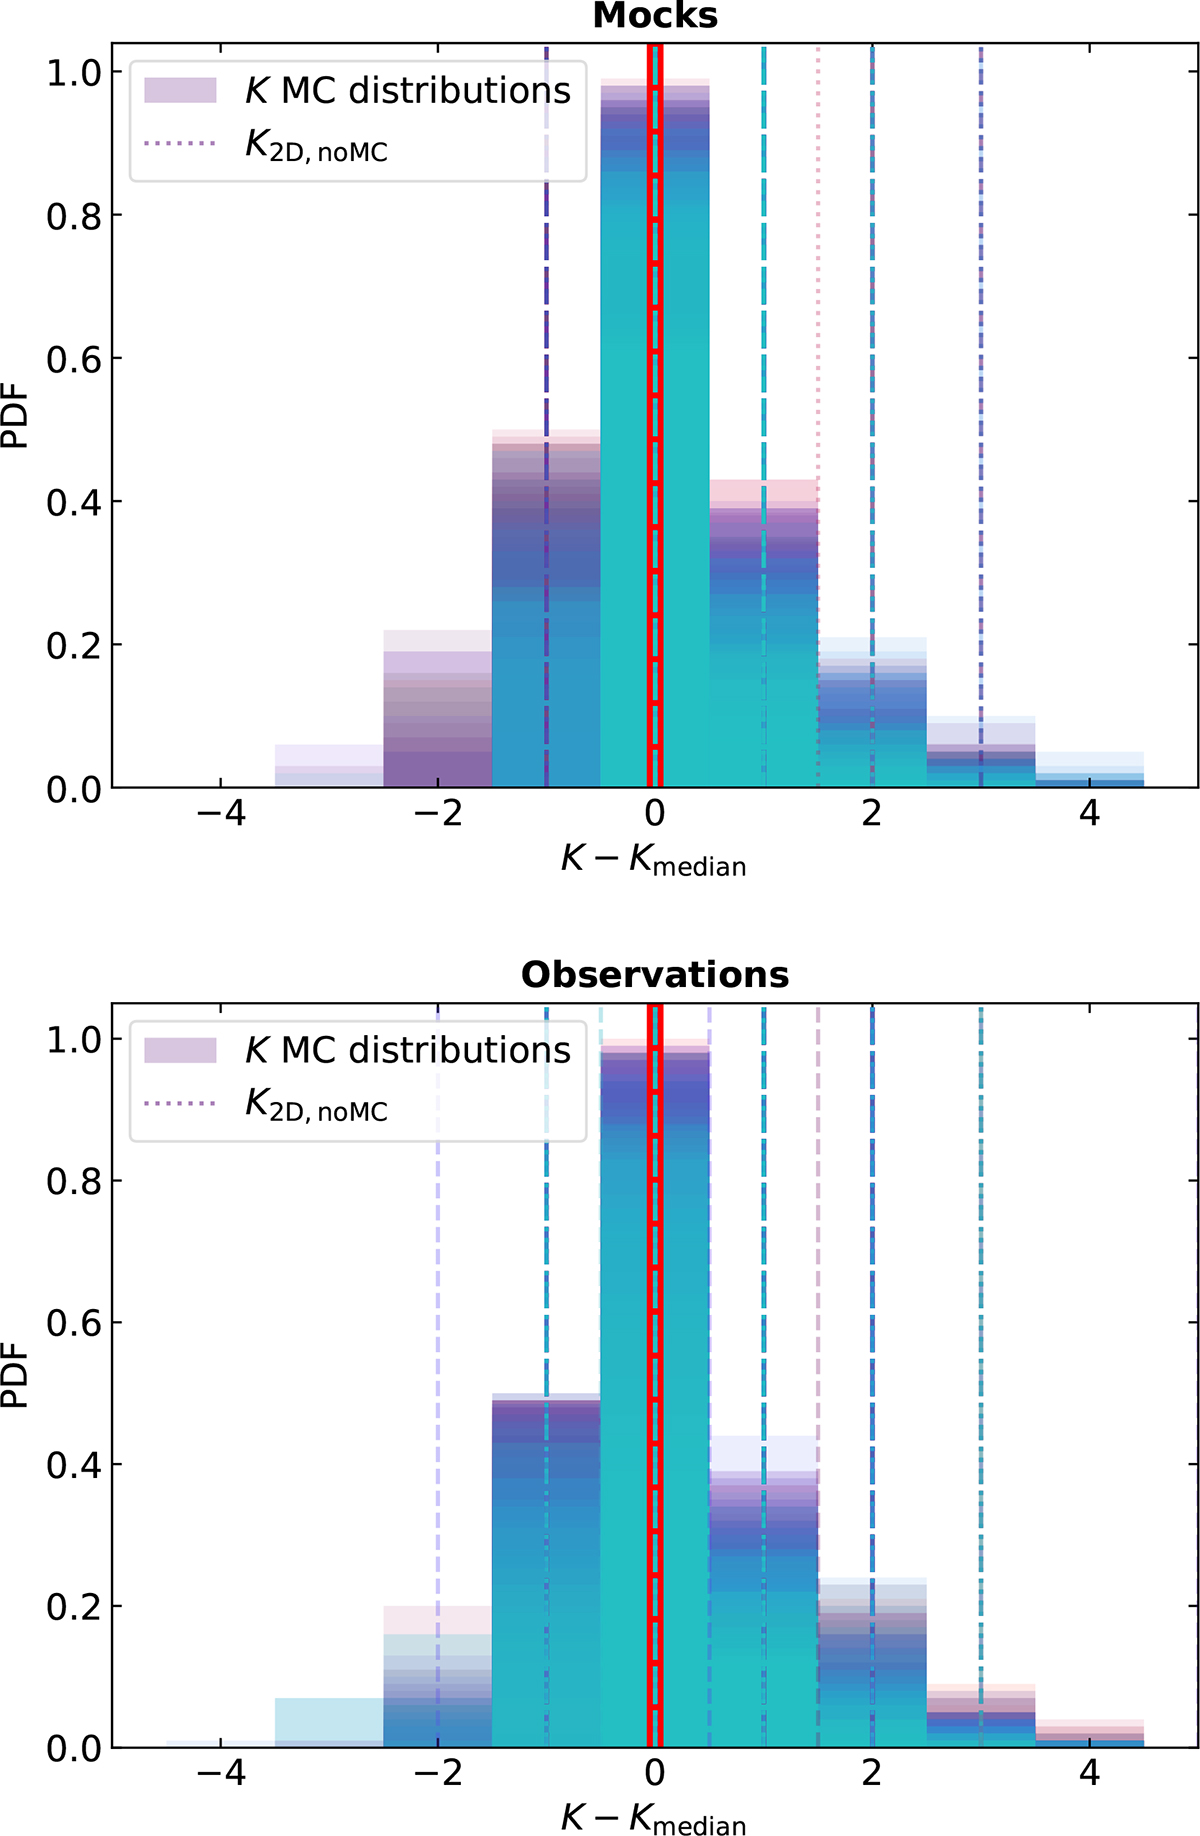
Fig. 5.
Download original image
Connectivity distributions of the Monte Carlo realisations for 300 random galaxies (different colours in the mock and observational datasets, shown respectively in the top and bottom panels. Each distribution is rescaled by its median value and therefore centred at x = 0 (thick vertical red line). The thin vertical lines with different line styles indicate the corresponding K2D, noMC values, i.e. the results from a single measurement in the fiducial catalogue, without Monte Carlo sampling. These lines are often superimposed due to a quantisation effect: K2D, noMC is an integer by definition; half-integer positions appear after rescaling when the median of the distribution is itself a half-integer.
Current usage metrics show cumulative count of Article Views (full-text article views including HTML views, PDF and ePub downloads, according to the available data) and Abstracts Views on Vision4Press platform.
Data correspond to usage on the plateform after 2015. The current usage metrics is available 48-96 hours after online publication and is updated daily on week days.
Initial download of the metrics may take a while.