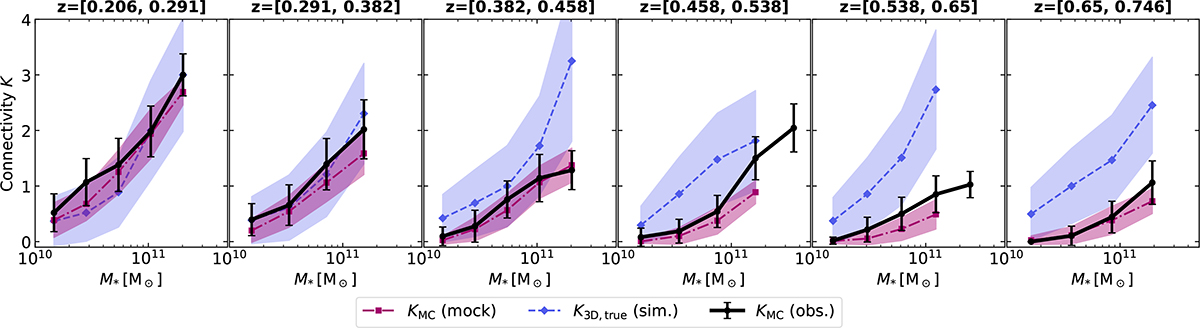
Fig. 6.
Download original image
Galaxy connectivity as a function of stellar mass, shown for different redshift bins (columns). Redshift bin edges were chosen to contain approximately the same number of observed galaxies. The black, magenta, and blue curves correspond to the mean connectivity measured from the observed JPAS+DESI galaxies, the mock galaxies, and the ideal 3D connectivity measurements, respectively (see details in Sect. 5.1). Averages based on fewer than five galaxies are not shown. The error bars correspond to the 1σ dispersion of the data points around the mean connectivity within a given mass bin.
Current usage metrics show cumulative count of Article Views (full-text article views including HTML views, PDF and ePub downloads, according to the available data) and Abstracts Views on Vision4Press platform.
Data correspond to usage on the plateform after 2015. The current usage metrics is available 48-96 hours after online publication and is updated daily on week days.
Initial download of the metrics may take a while.