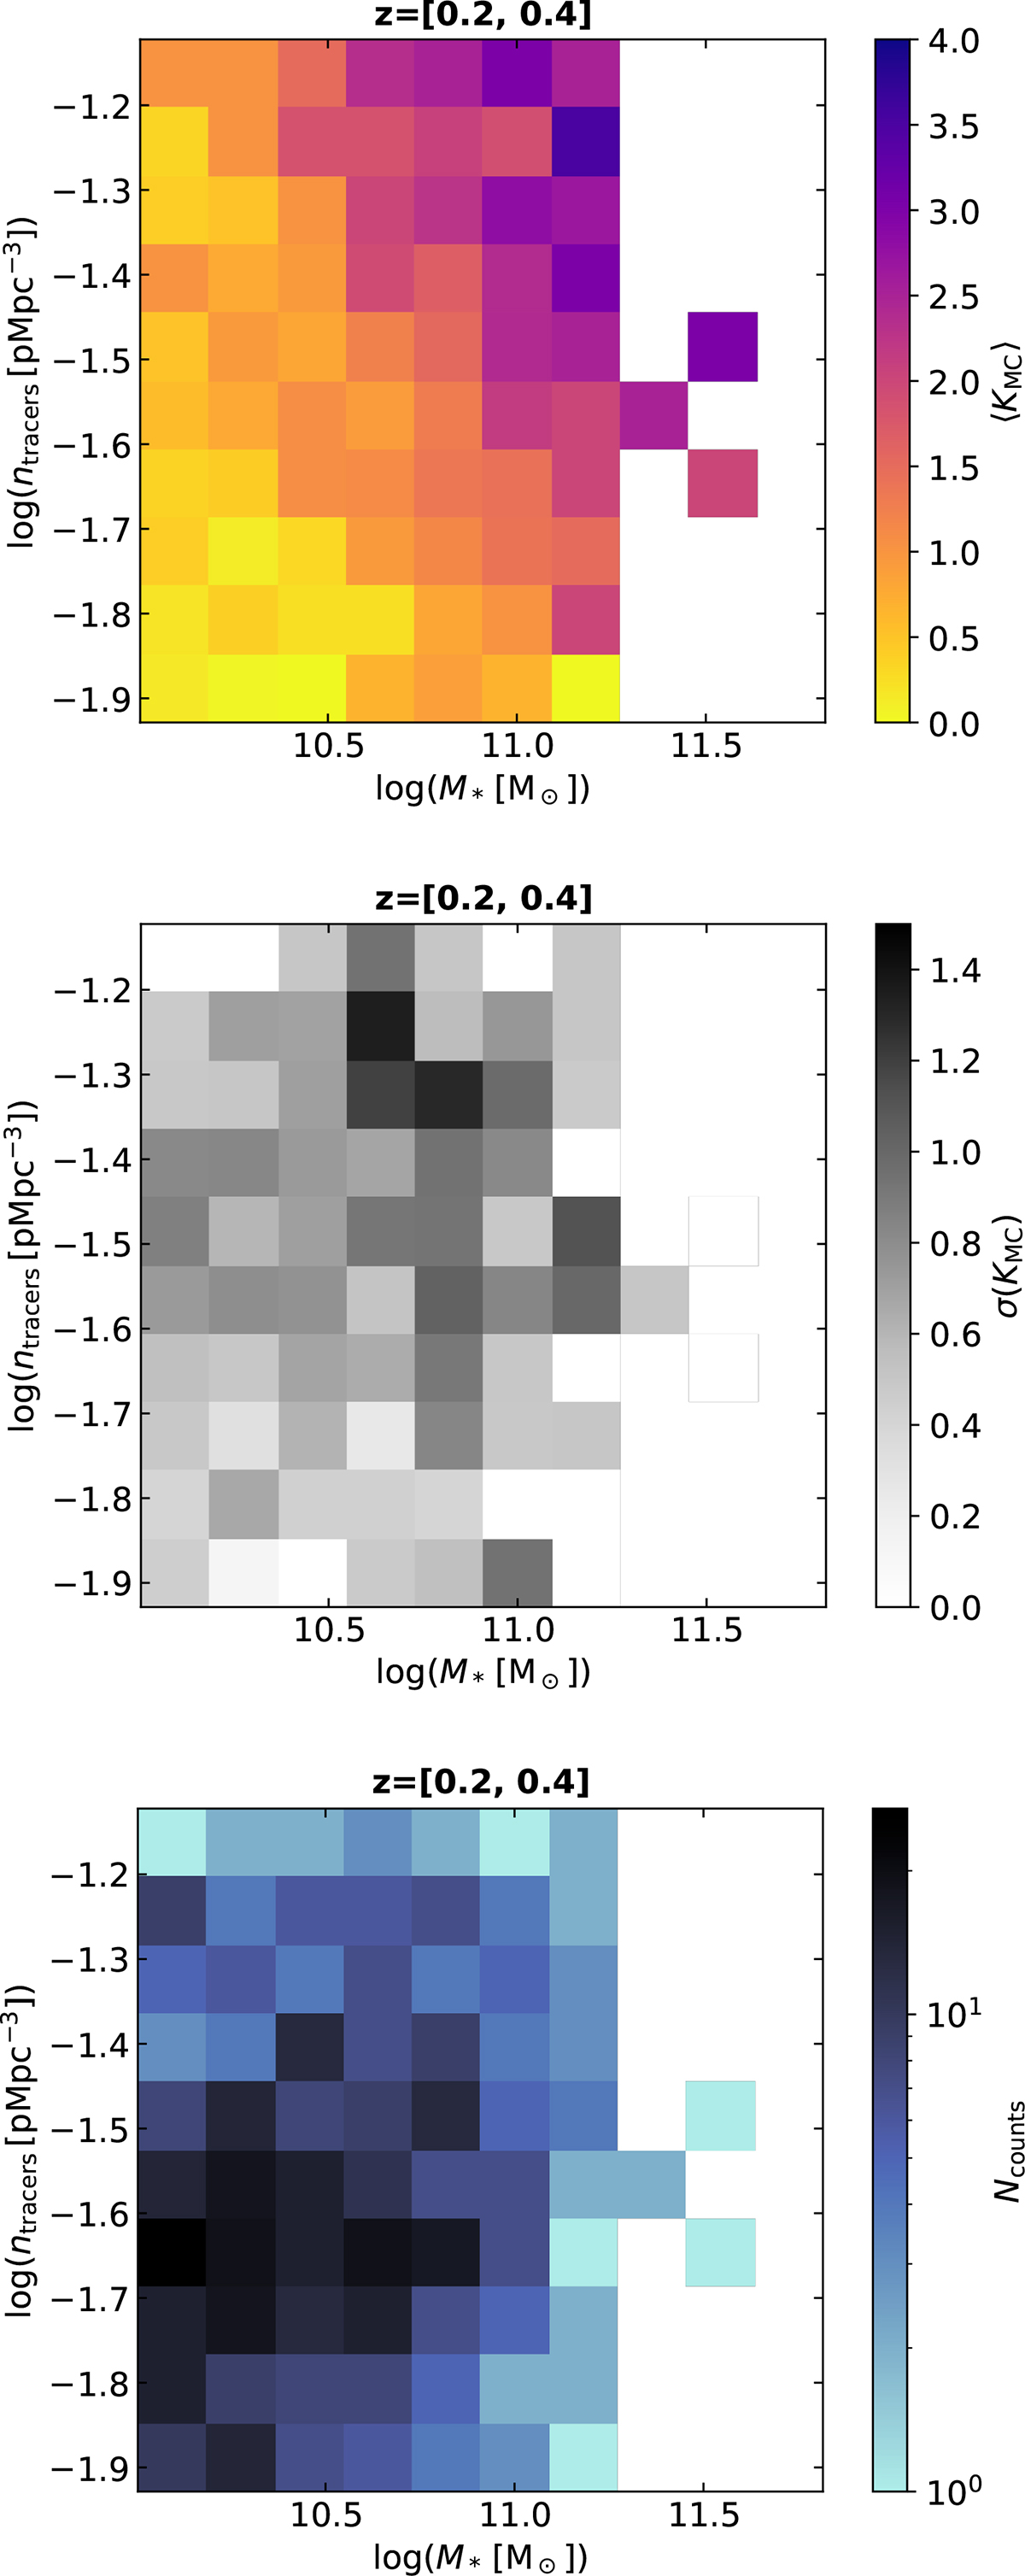
Fig. 7.
Download original image
Top: Connectivity of JPAS+DESI target galaxies in the mass-density plane for the low redshift subsample. Pixel colours represent the mean connectivity, ⟨KMC⟩, computed within each small bin of the mass–density space. Middle: Standard deviation of the connectivity values within the same bins. Bottom: Number of galaxies per bin.
Current usage metrics show cumulative count of Article Views (full-text article views including HTML views, PDF and ePub downloads, according to the available data) and Abstracts Views on Vision4Press platform.
Data correspond to usage on the plateform after 2015. The current usage metrics is available 48-96 hours after online publication and is updated daily on week days.
Initial download of the metrics may take a while.