Fig. 9.
Download original image
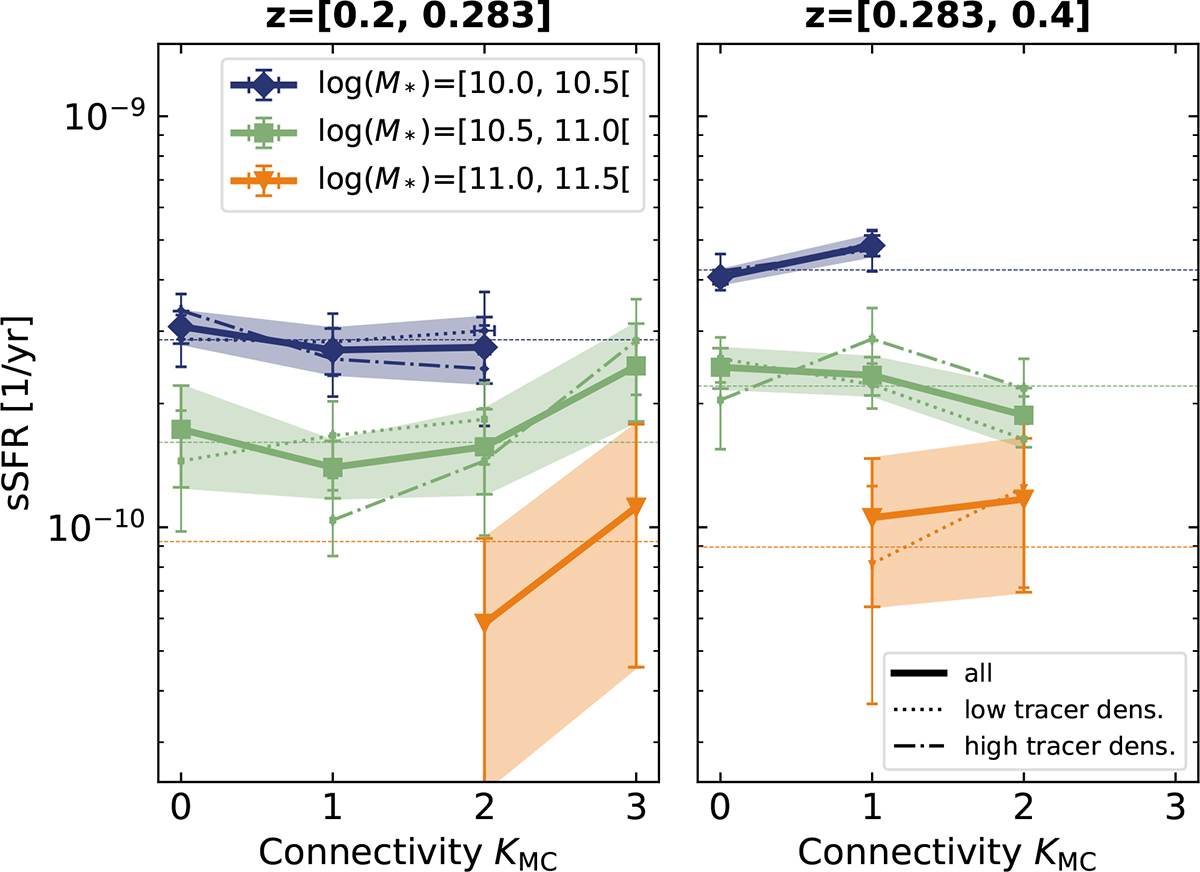
Specific star formation rate (sSFR) as a function of galaxy connectivity for the observed JPAS+DESI galaxies, shown across different redshift and stellar mass bins. Different line styles show galaxies in different tracer density bins. Galaxies in groups and clusters are excluded. Each point represents the mean sSFR at a given KMC value; points based on fewer than three galaxies are not shown. Thin dashed horizontal lines indicate the average sSFR of the overall population in each mass bin. Error bars correspond to the standard errors of the mean, i.e. the standard deviation normalised by the square root of the number of data points in that bin.
Current usage metrics show cumulative count of Article Views (full-text article views including HTML views, PDF and ePub downloads, according to the available data) and Abstracts Views on Vision4Press platform.
Data correspond to usage on the plateform after 2015. The current usage metrics is available 48-96 hours after online publication and is updated daily on week days.
Initial download of the metrics may take a while.