Open Access
Fig. A.3.
Download original image
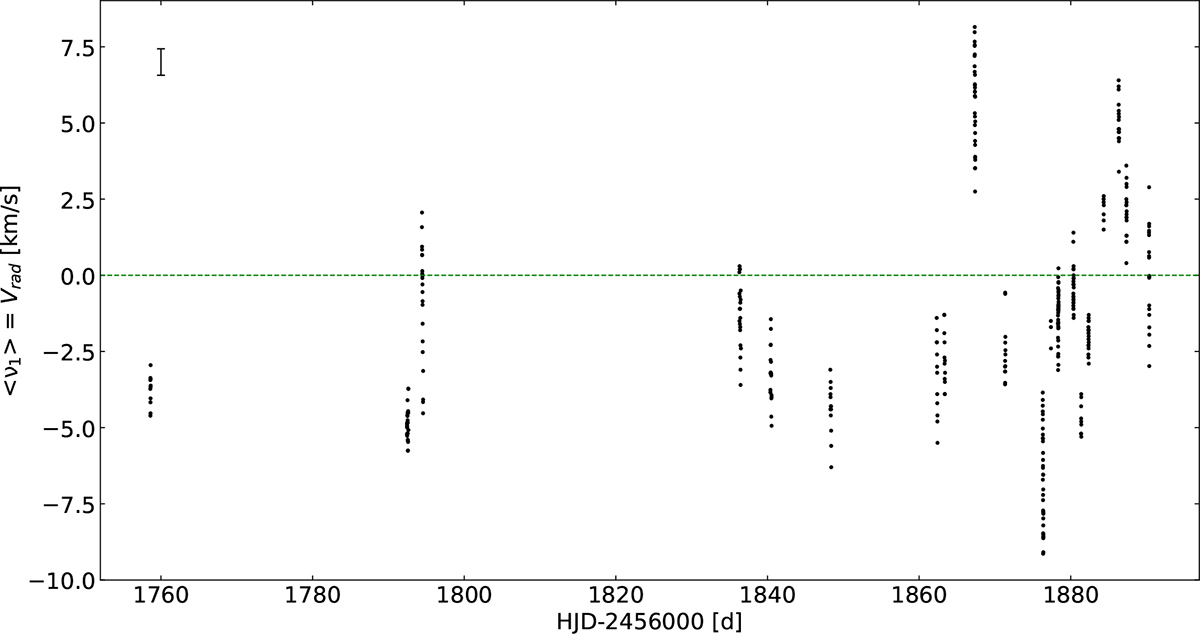
First-moment (radial velocity) variations of the He I 6678.151 Å line profile during Season 2017 (4 January 2017 – 16 May 2017). Each point corresponds to one separate spectrum. A typical error bar is shown in the top left corner. The 2017 spectra were obtained just before the K2 campaign. The data are available at CDS.
Current usage metrics show cumulative count of Article Views (full-text article views including HTML views, PDF and ePub downloads, according to the available data) and Abstracts Views on Vision4Press platform.
Data correspond to usage on the plateform after 2015. The current usage metrics is available 48-96 hours after online publication and is updated daily on week days.
Initial download of the metrics may take a while.