Fig. 7.
Download original image
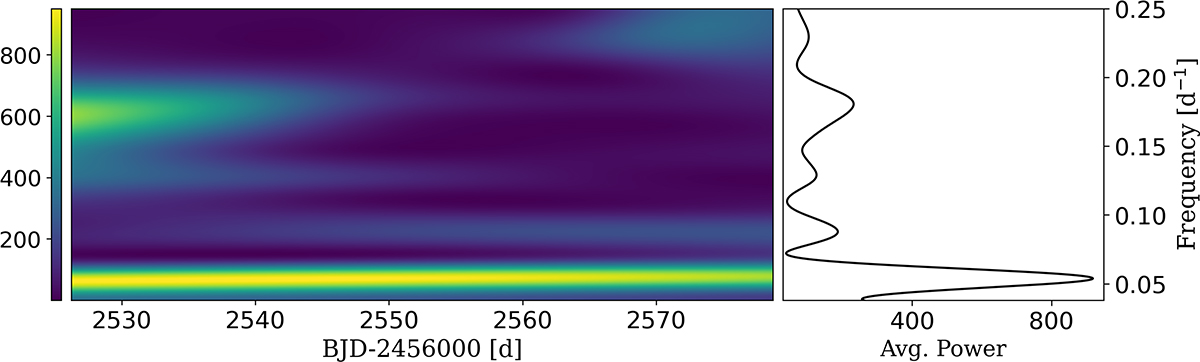
WWZ scalogram for TESS photometry. The wavelet power is indicated by the colour (see colour bar at left). The lower bright stripe corresponds to the period of ∼18 days. A faint stripe appears above it, which corresponds to a period of ∼11 days. Shorter periods of 8 and 5.4 days appear as non-permanent spot-like regions in the upper part on the colour scalogram. The black solid line in the right panel shows the time-averaged wavelet power.
Current usage metrics show cumulative count of Article Views (full-text article views including HTML views, PDF and ePub downloads, according to the available data) and Abstracts Views on Vision4Press platform.
Data correspond to usage on the plateform after 2015. The current usage metrics is available 48-96 hours after online publication and is updated daily on week days.
Initial download of the metrics may take a while.