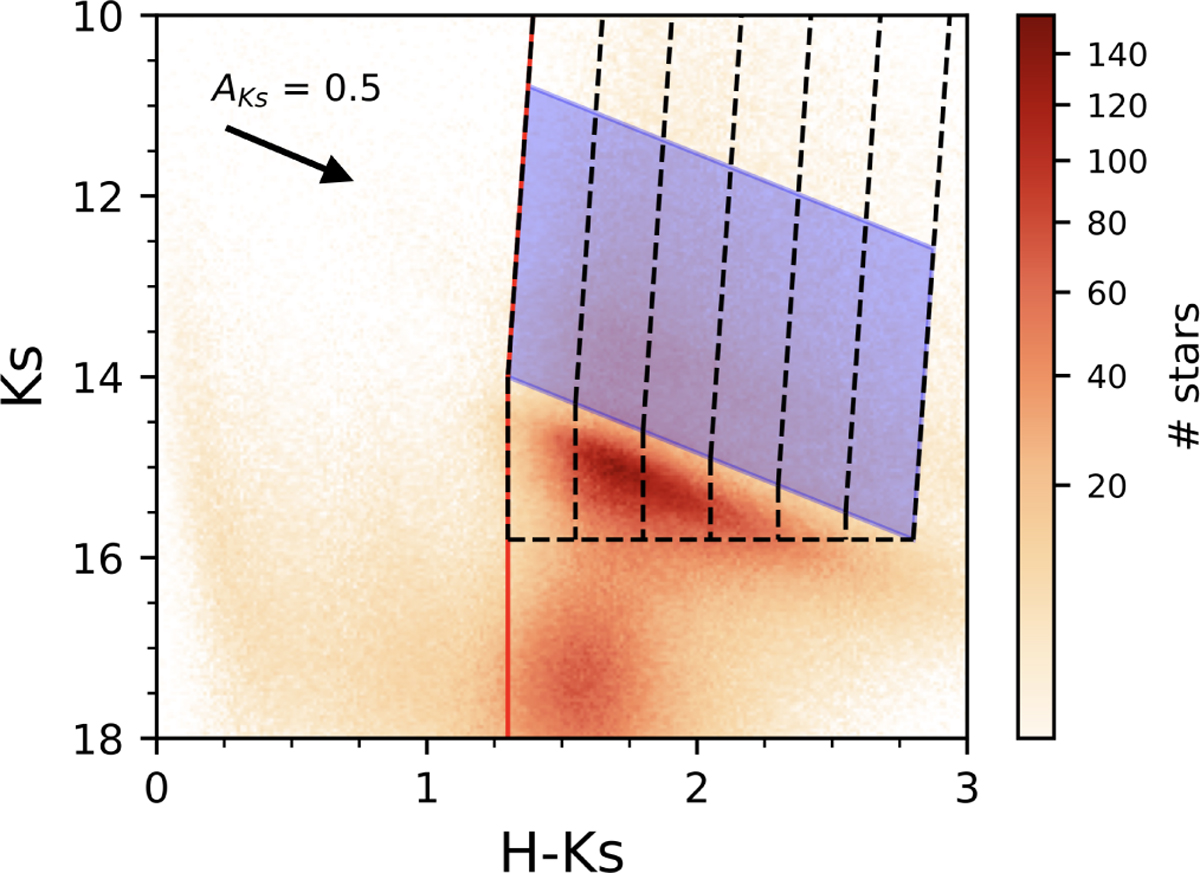
Fig. 2
Download original image
Colour-magnitude diagram Ks versus H - Ks of the stars in the upper panel of Fig. 1. The colour scale shows stellar densities using a power stretch scale. The red line indicates the colour cut applied to remove foreground stars (see Sect. 2.1). The shaded blue parallelogram indicates the selection box for the proper motion analysis described in Sect. 3.3, whereas the dashed black lines indicate the colour bins for the stellar density analysis in Sect. 4. The black arrow shows the direction of the reddening vector.
Current usage metrics show cumulative count of Article Views (full-text article views including HTML views, PDF and ePub downloads, according to the available data) and Abstracts Views on Vision4Press platform.
Data correspond to usage on the plateform after 2015. The current usage metrics is available 48-96 hours after online publication and is updated daily on week days.
Initial download of the metrics may take a while.