Fig. 3
Download original image
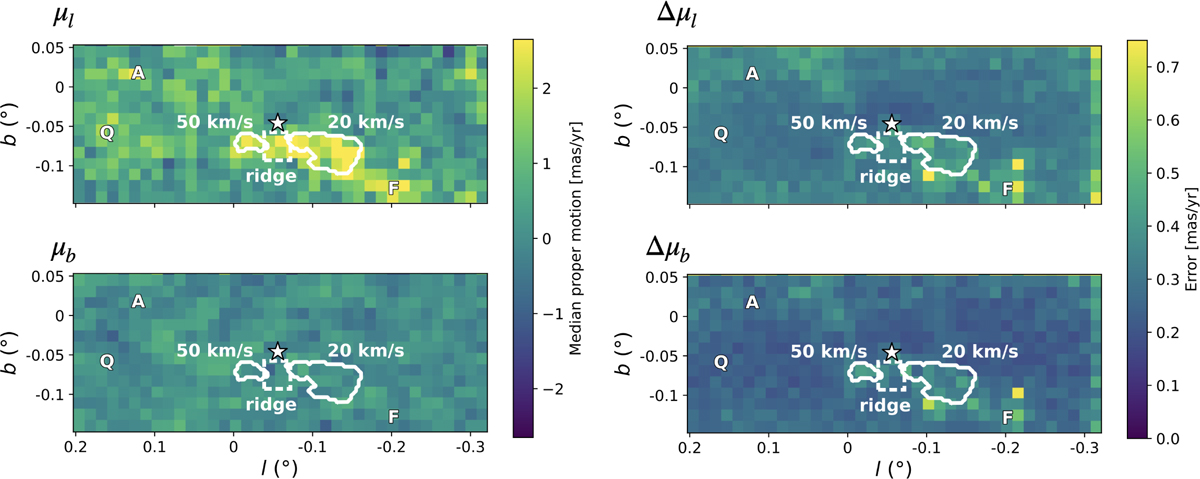
Median proper motion maps (first column) and corresponding uncertainty maps (second column). The positions of the 50 and 20 km∕s clouds are indicated, along with a region of high μl values marked as the ‘ridge’. The white star marks the position of Sgr A*, and ‘A’ and ‘Q’ denote the Arches and Quintuplet clusters (e.g. Clark et al. 2018; Rui et al. 2019). The ‘F’ marks a region showing higher proper motions than its surroundings, probably due to a dark cloud in front of the CMZ. Colour scales are set independently for the median and uncertainty panels to match the range of their respective values.
Current usage metrics show cumulative count of Article Views (full-text article views including HTML views, PDF and ePub downloads, according to the available data) and Abstracts Views on Vision4Press platform.
Data correspond to usage on the plateform after 2015. The current usage metrics is available 48-96 hours after online publication and is updated daily on week days.
Initial download of the metrics may take a while.