Open Access
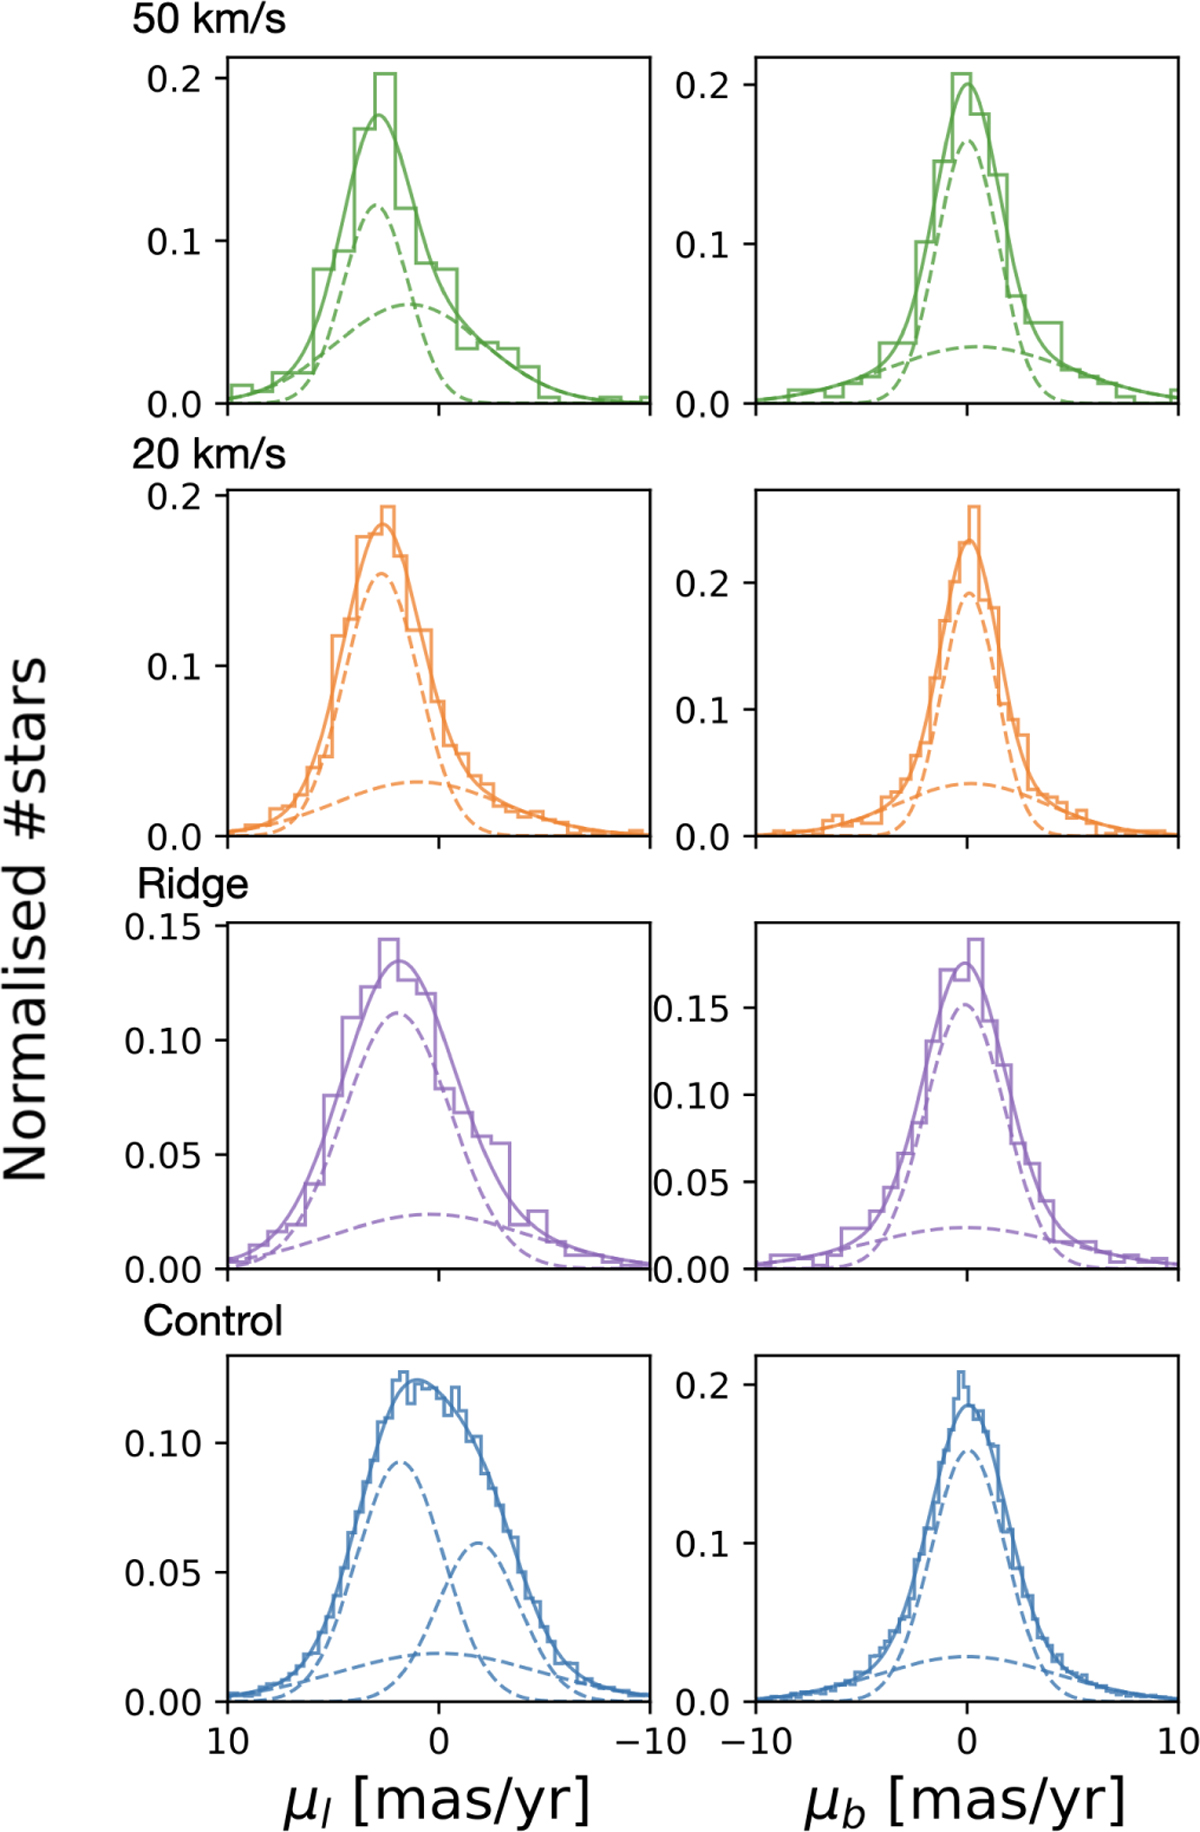
Fig. 4
Download original image
GMM decomposition of μl and μb for stars in the regions associated with the 50 and 20km/s clouds, the ridge, and the control field. Dashed lines indicate the individual Gaussian components, and the solid line shows the combined model.
Current usage metrics show cumulative count of Article Views (full-text article views including HTML views, PDF and ePub downloads, according to the available data) and Abstracts Views on Vision4Press platform.
Data correspond to usage on the plateform after 2015. The current usage metrics is available 48-96 hours after online publication and is updated daily on week days.
Initial download of the metrics may take a while.