Fig. 5
Download original image
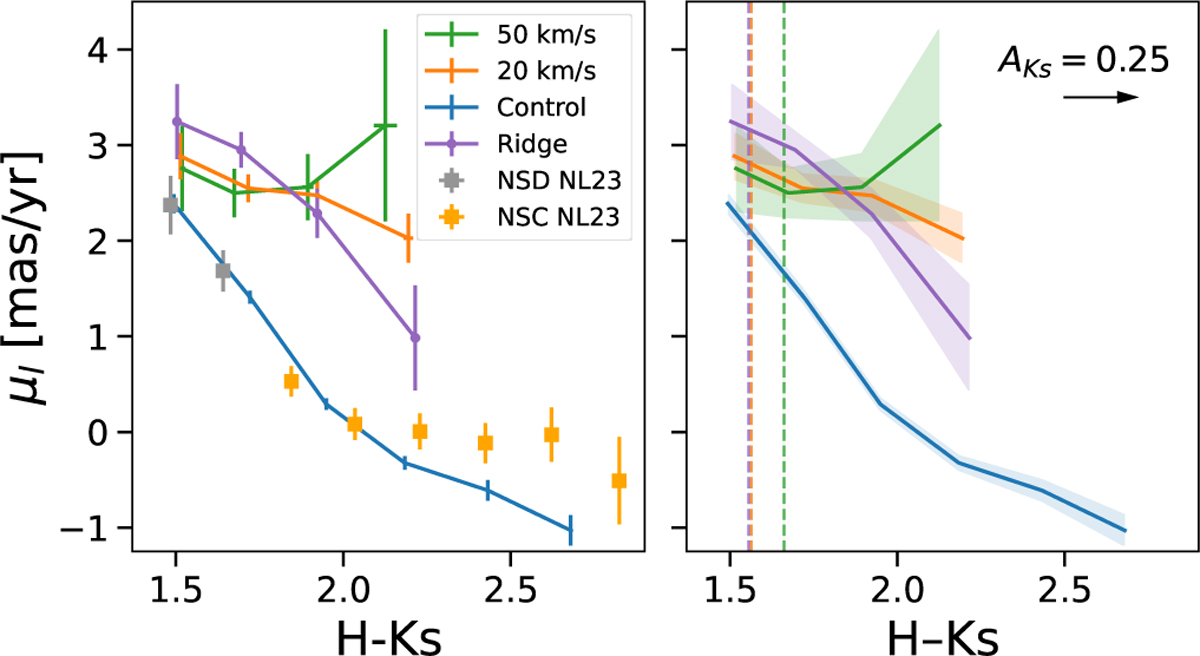
Left panel: μl as a function of H - Ks, used as an extinction proxy. Error bars indicate the uncertainties for each data point. Grey and orange points show the results obtained by Nogueras-Lara et al. (2023a) along the line of sight towards the nuclear star cluster (NSC; see the legend). Right panel: interpolated values and associated uncertainties. The vertical lines mark the H - Ks values at which the μl of the cloud regions differ by 3σ from that of the control field. The black arrow shows the direction of increasing extinction with H - Ks.
Current usage metrics show cumulative count of Article Views (full-text article views including HTML views, PDF and ePub downloads, according to the available data) and Abstracts Views on Vision4Press platform.
Data correspond to usage on the plateform after 2015. The current usage metrics is available 48-96 hours after online publication and is updated daily on week days.
Initial download of the metrics may take a while.