Fig. 6
Download original image
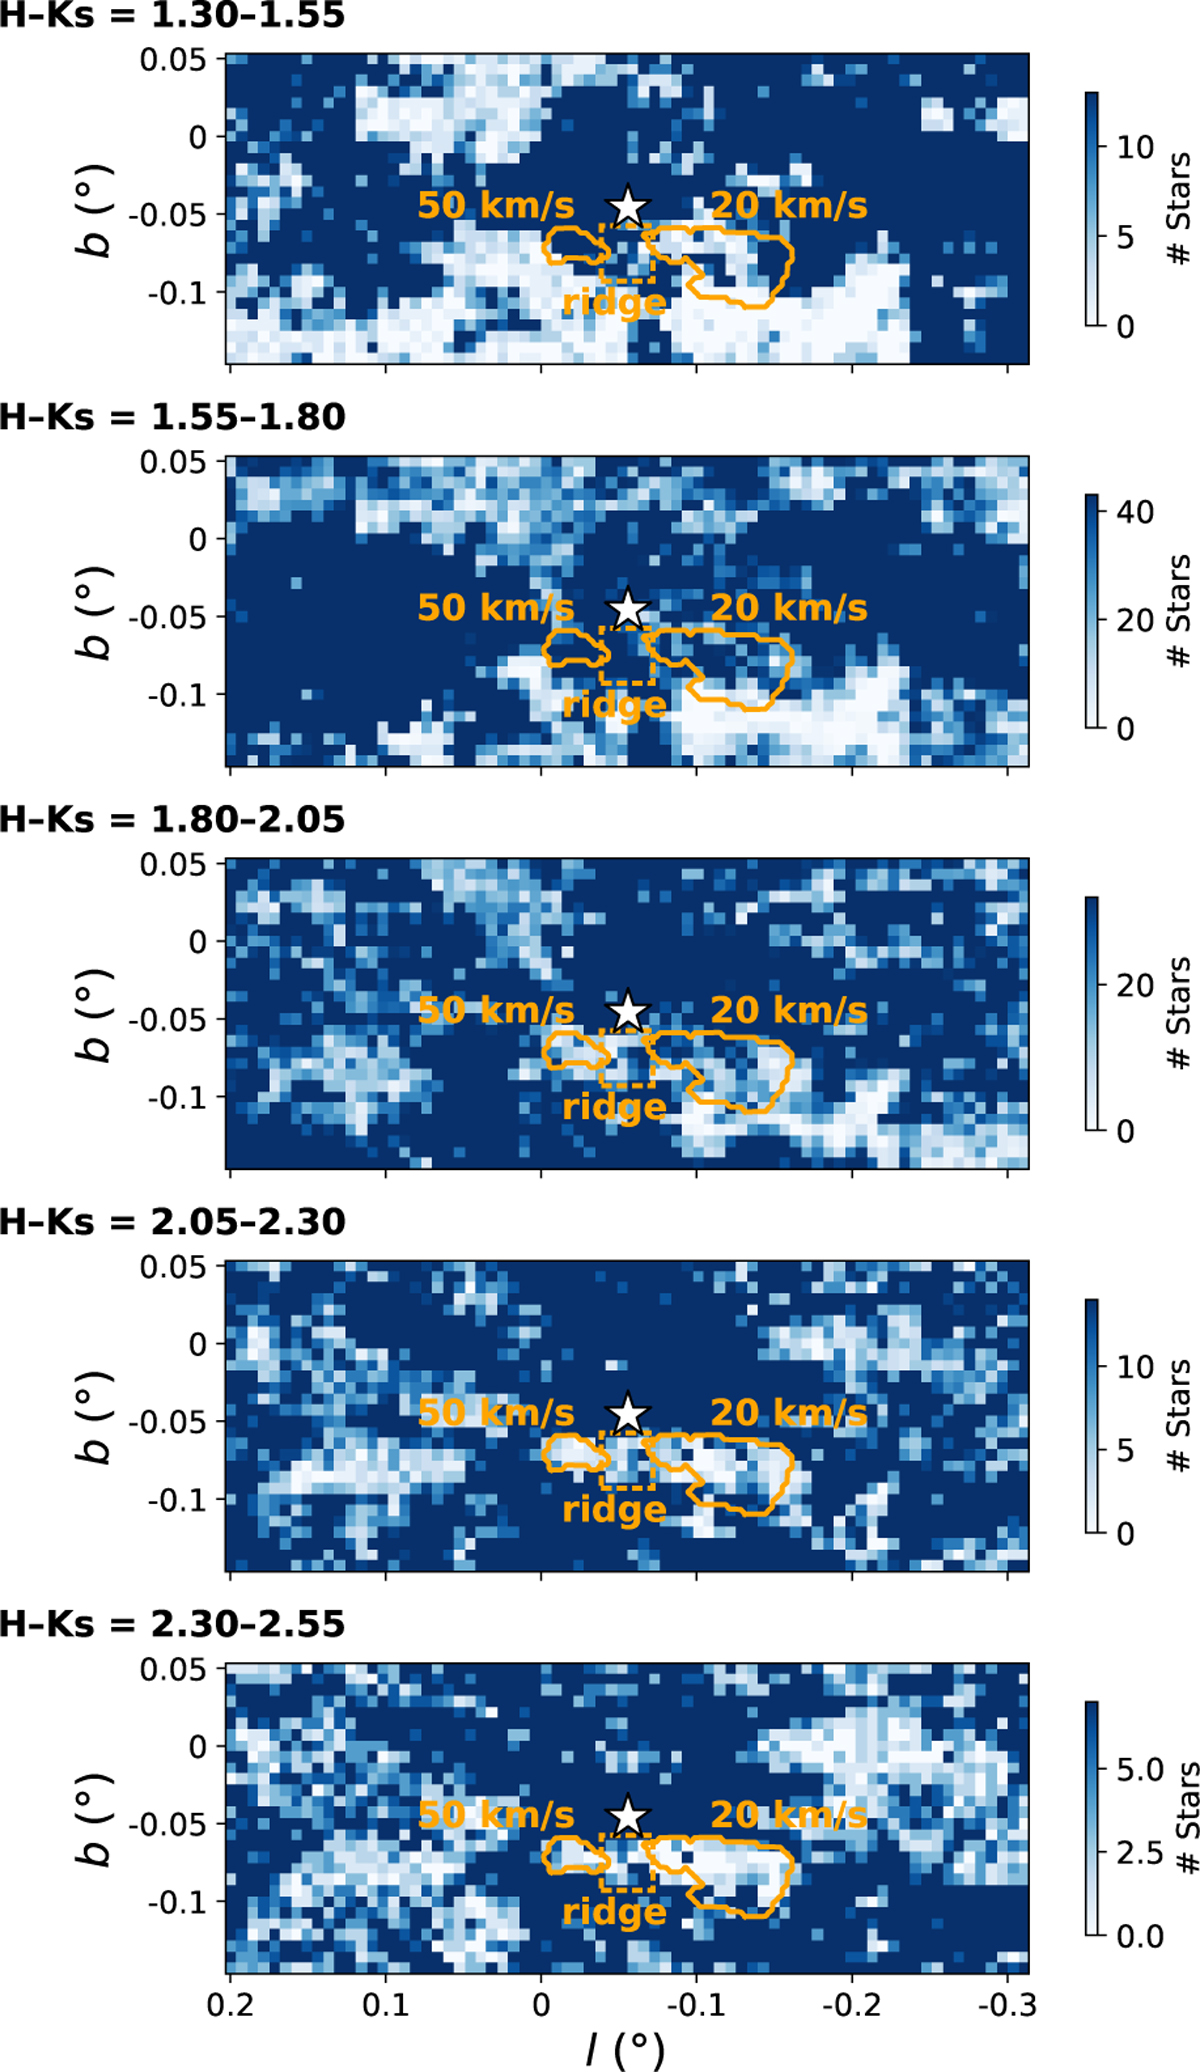
Stellar density maps of the target region for different colour cuts, with increasing extinction from top to bottom. Each panel indicates the range of the corresponding colour cut. The 50 and 20km/s clouds are marked with orange circular regions, and the ridge is indicated by a dashed orange rectangle. The white star in each panel indicates the position of Sgr A*. The colour scale represents the number of stars per pixel and is adapted in each panel to the number of stars in the 50 and 20 km/s clouds for an easier comparison with the surrounding area.
Current usage metrics show cumulative count of Article Views (full-text article views including HTML views, PDF and ePub downloads, according to the available data) and Abstracts Views on Vision4Press platform.
Data correspond to usage on the plateform after 2015. The current usage metrics is available 48-96 hours after online publication and is updated daily on week days.
Initial download of the metrics may take a while.