Fig. 7
Download original image
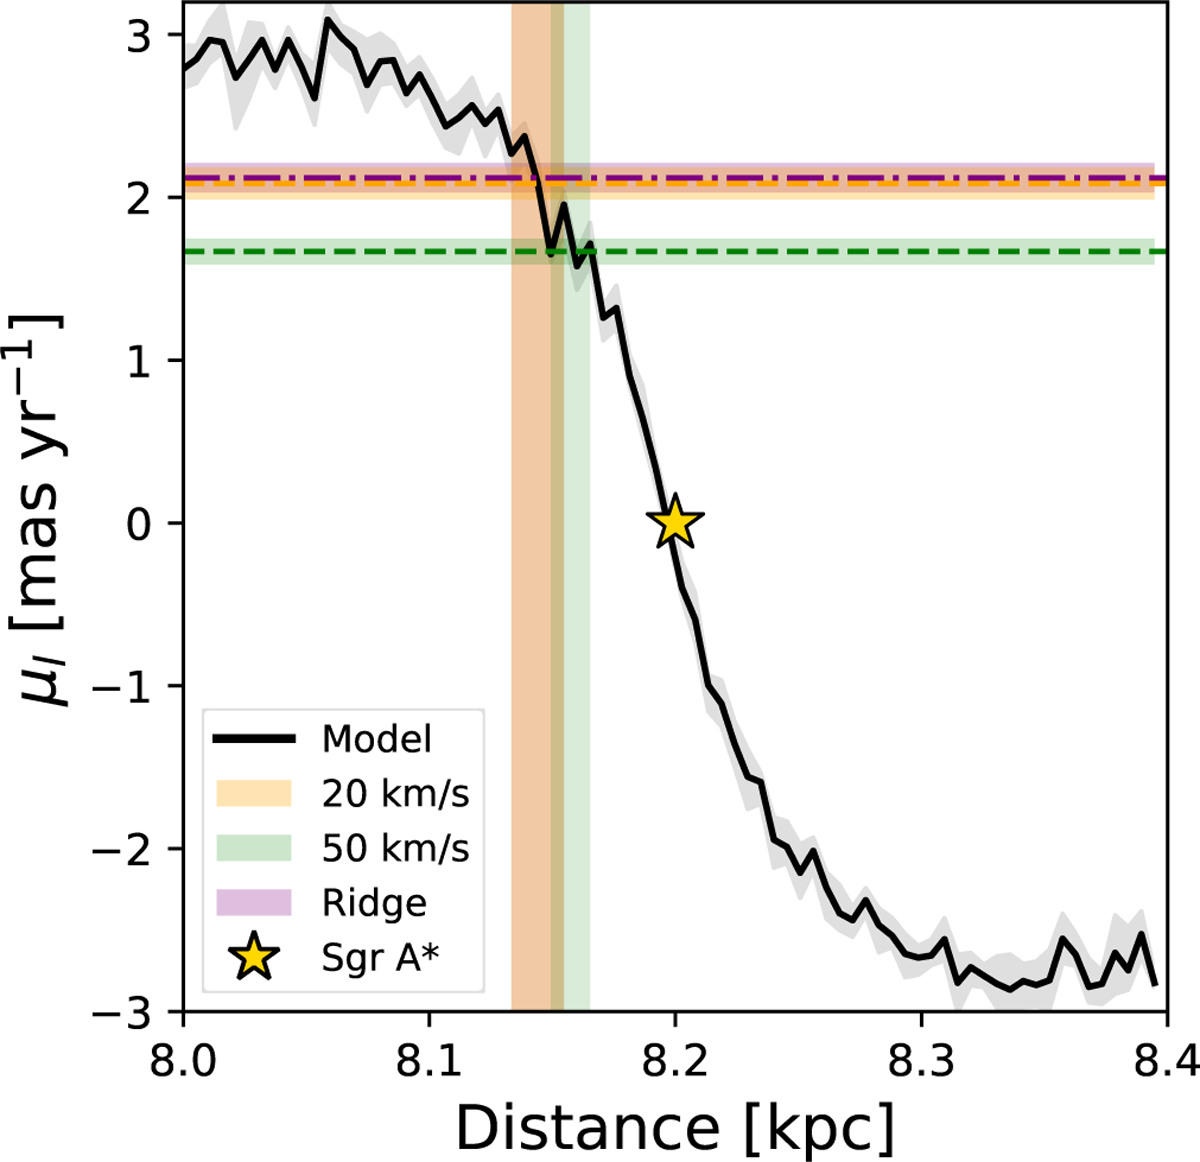
Theoretical μl profile obtained for the control region in Fig. 1. The grey shaded region indicates the model uncertainty. The position of Sgr A* (8.2kpc and 0 mas/yr) is marked by the yellow star. The orange, green, and purple horizontal lines indicate the μl values at which the clouds are detected (μl differing from that of the control field at the 3σ level), with their uncertainties shown as shaded regions. The corresponding estimated distance ranges of the clouds are shown as vertical shaded regions.
Current usage metrics show cumulative count of Article Views (full-text article views including HTML views, PDF and ePub downloads, according to the available data) and Abstracts Views on Vision4Press platform.
Data correspond to usage on the plateform after 2015. The current usage metrics is available 48-96 hours after online publication and is updated daily on week days.
Initial download of the metrics may take a while.