Fig. 8
Download original image
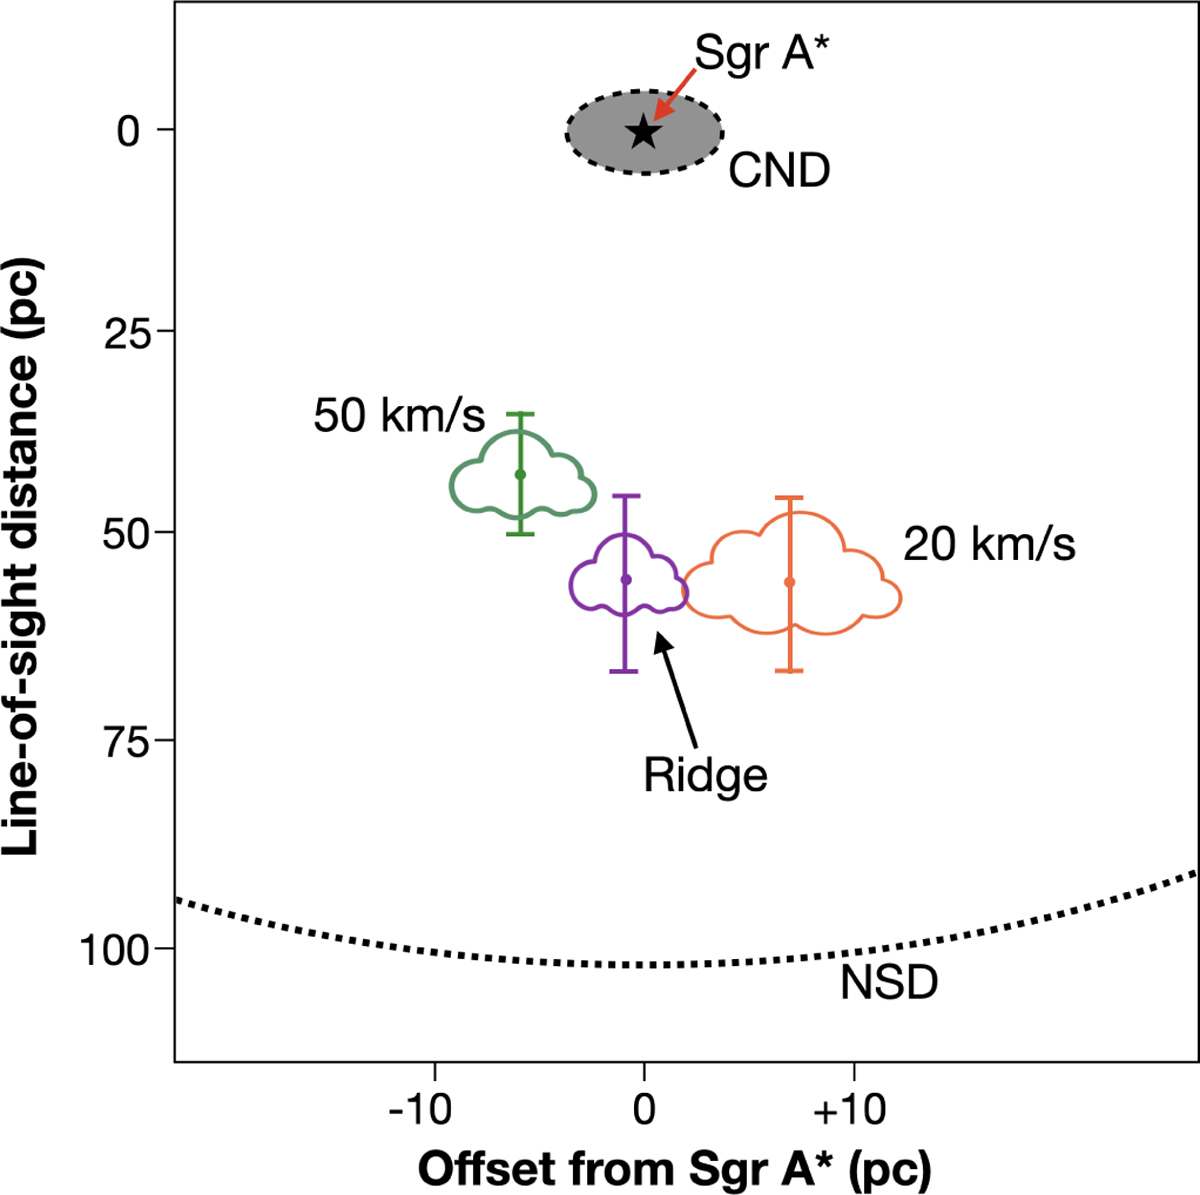
Top-down schematic view of the line-of-sight positions of the 50 and 20 km/s clouds and the ridge, inferred from the self-consistent NSD model of Sormani et al. (2022) and the μl versus H - Ks relation explained in Sect. 3.3. This plot assumes that the position of the clouds and the ridge is that at which their μl values are 3 σ different from that of the control field. The x- and y-axis scales differ to optimise the visualisation of the relative distances. The positions of Sgr A* and the circumnuclear disc (CND) are also shown. The dotted black line marks the scale length of the NSD (e.g. Gallego-Cano et al. 2020; Sormani et al. 2022).
Current usage metrics show cumulative count of Article Views (full-text article views including HTML views, PDF and ePub downloads, according to the available data) and Abstracts Views on Vision4Press platform.
Data correspond to usage on the plateform after 2015. The current usage metrics is available 48-96 hours after online publication and is updated daily on week days.
Initial download of the metrics may take a while.