Fig. 9
Download original image
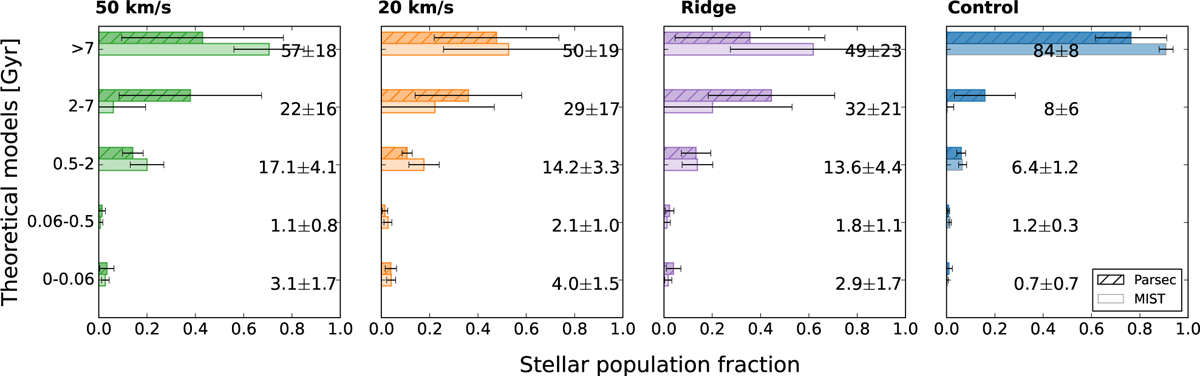
Results of the Ks luminosity function fitting for the 50 and 20 km/s clouds, the ridge, and the control field regions. The numbers in each panel represent the percentage contribution of each age bin, with the associated uncertainty calculated as the average of the results from the PARSEC and MIST models (as indicated in the legend).
Current usage metrics show cumulative count of Article Views (full-text article views including HTML views, PDF and ePub downloads, according to the available data) and Abstracts Views on Vision4Press platform.
Data correspond to usage on the plateform after 2015. The current usage metrics is available 48-96 hours after online publication and is updated daily on week days.
Initial download of the metrics may take a while.