Open Access
Fig. 10.
Download original image
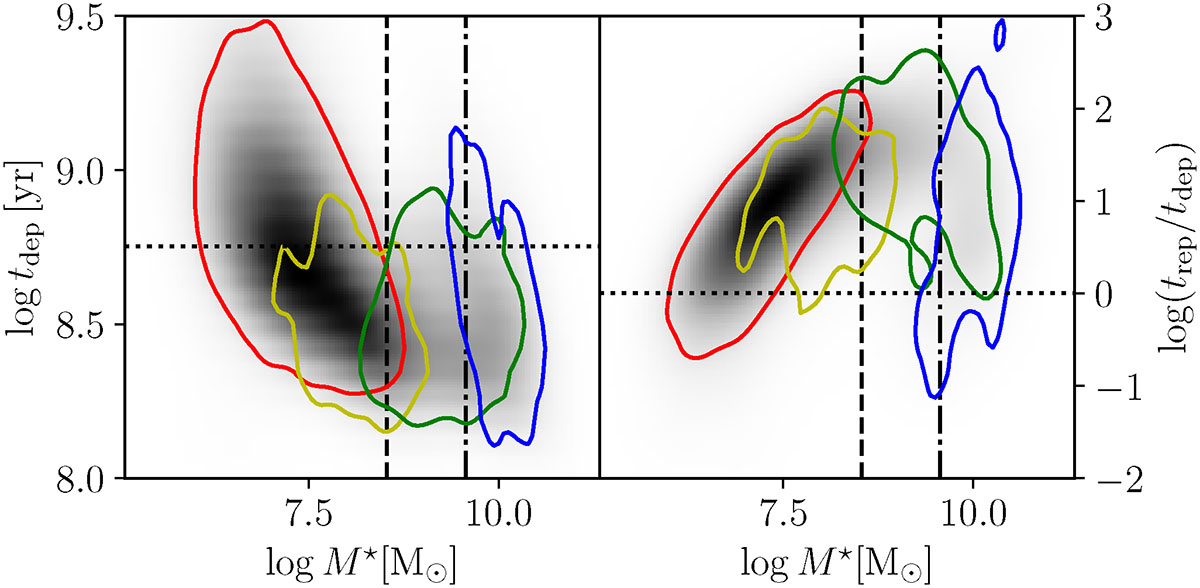
Depletion time (left panel) and the ratio of replenishment-to-depletion times (right panel) within ![]() , as a function of stellar mass. References are as in Fig. 7. The dotted horizontal line in the left panel shows the timespan of the simulations, whereas that in the right panel marks the unit ratio.
, as a function of stellar mass. References are as in Fig. 7. The dotted horizontal line in the left panel shows the timespan of the simulations, whereas that in the right panel marks the unit ratio.
Current usage metrics show cumulative count of Article Views (full-text article views including HTML views, PDF and ePub downloads, according to the available data) and Abstracts Views on Vision4Press platform.
Data correspond to usage on the plateform after 2015. The current usage metrics is available 48-96 hours after online publication and is updated daily on week days.
Initial download of the metrics may take a while.