Open Access
Fig. 14.
Download original image
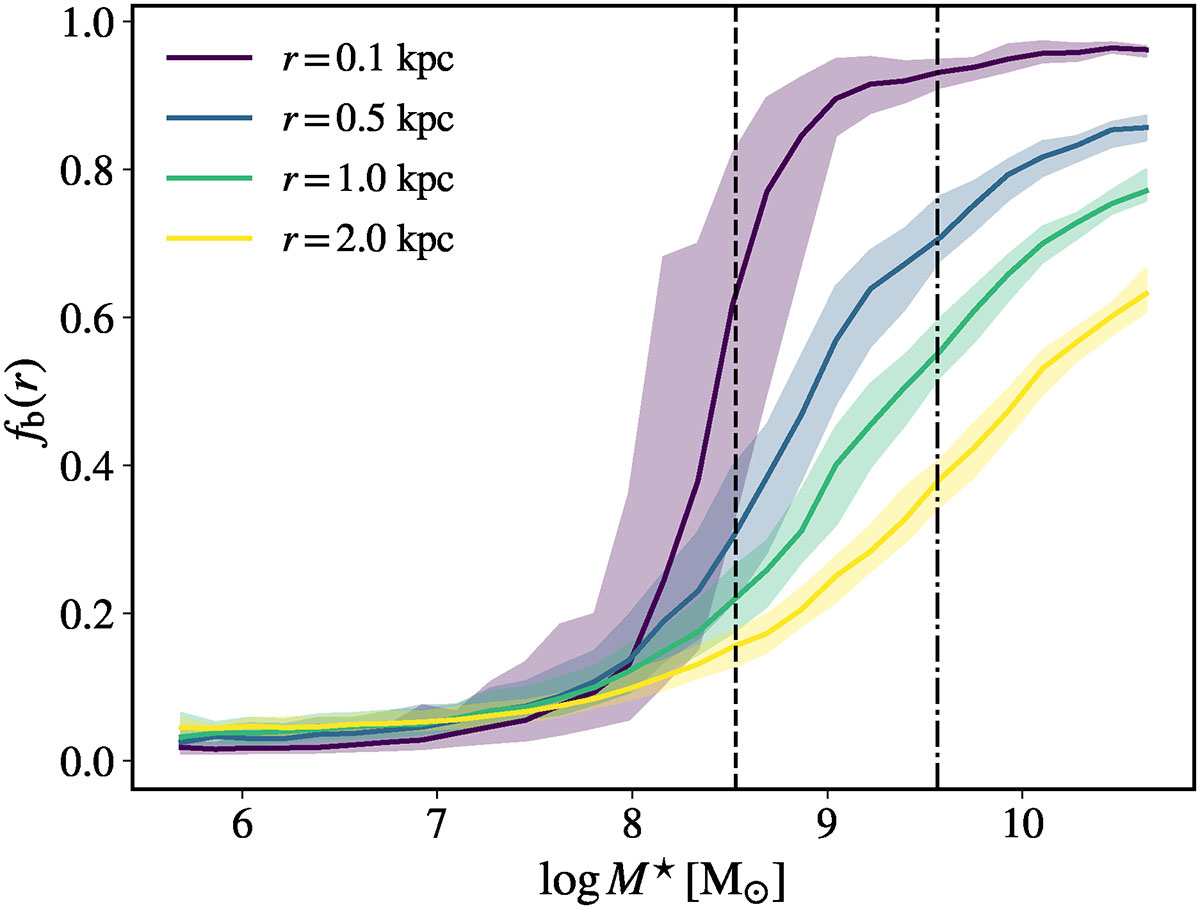
Fraction of baryons within spheres of different radii r (indicated by different colours) as a function of stellar mass. Solid lines display the median over all galaxies, whereas shaded regions represent the dispersion of each distribution.
Current usage metrics show cumulative count of Article Views (full-text article views including HTML views, PDF and ePub downloads, according to the available data) and Abstracts Views on Vision4Press platform.
Data correspond to usage on the plateform after 2015. The current usage metrics is available 48-96 hours after online publication and is updated daily on week days.
Initial download of the metrics may take a while.