Fig. 7.
Download original image
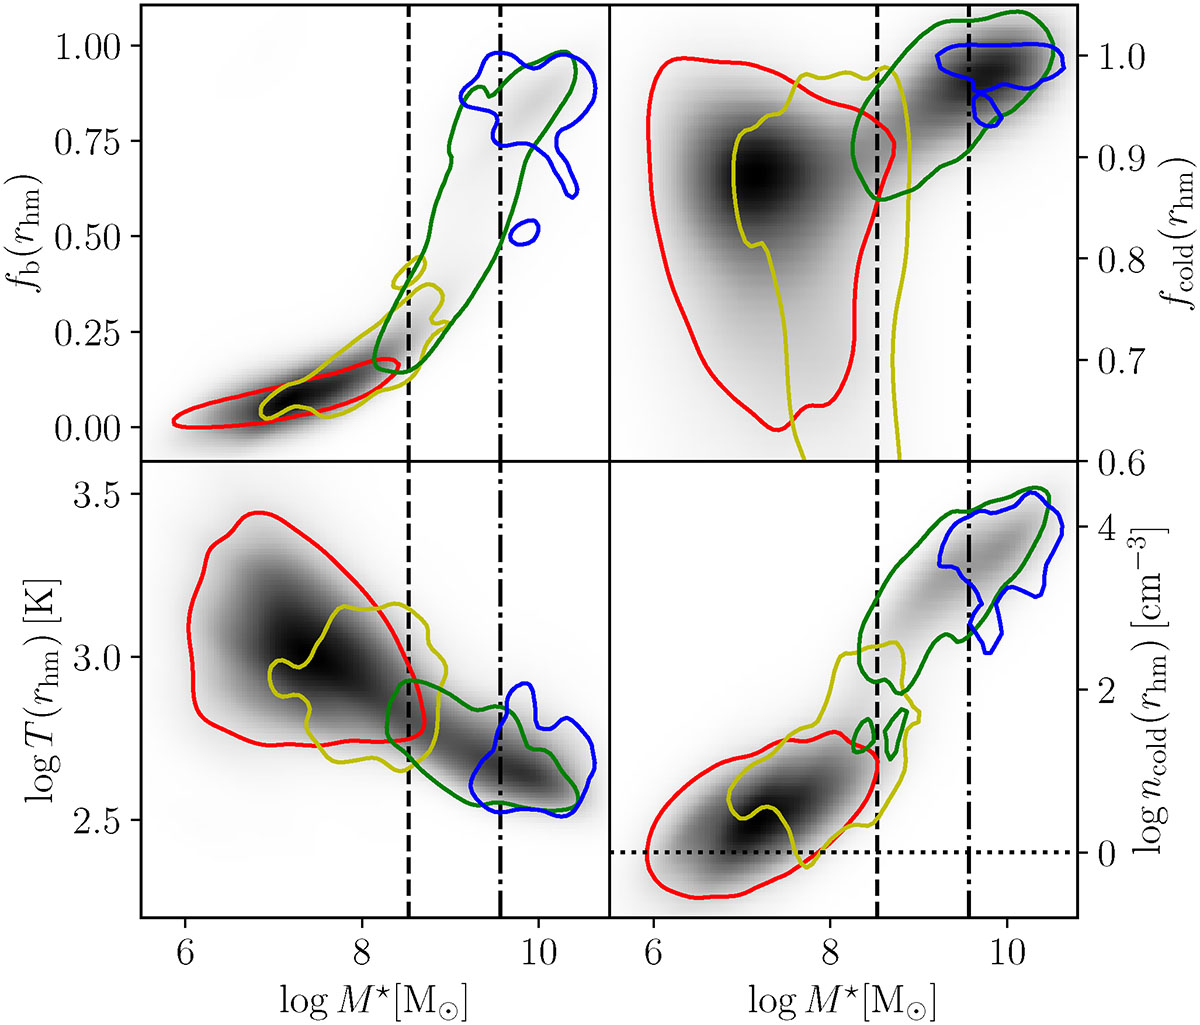
Dependence of different properties of baryons on the stellar mass. Top panels: Fraction of baryons (left) and cold gas (right) within ![]() . Bottom panels: Density-weighted mean gas temperature (left) and mean density (right) within
. Bottom panels: Density-weighted mean gas temperature (left) and mean density (right) within ![]() . The grey shades represent the density of galaxies in the plane defined by stellar mass and the corresponding property, computed from the data using a Gaussian smoothing kernel (normalization is different for each panel). Colour contours enclose 80% of the systems in different SSs (SS1: red, SS2: yellow, SS3: green, SS4: blue). The dashed and dash-dotted vertical lines mark
. The grey shades represent the density of galaxies in the plane defined by stellar mass and the corresponding property, computed from the data using a Gaussian smoothing kernel (normalization is different for each panel). Colour contours enclose 80% of the systems in different SSs (SS1: red, SS2: yellow, SS3: green, SS4: blue). The dashed and dash-dotted vertical lines mark ![]() and
and ![]() , respectively, whereas the dotted horizontal line represent the density threshold for star formation.
, respectively, whereas the dotted horizontal line represent the density threshold for star formation.
Current usage metrics show cumulative count of Article Views (full-text article views including HTML views, PDF and ePub downloads, according to the available data) and Abstracts Views on Vision4Press platform.
Data correspond to usage on the plateform after 2015. The current usage metrics is available 48-96 hours after online publication and is updated daily on week days.
Initial download of the metrics may take a while.