Fig. 1.
Download original image
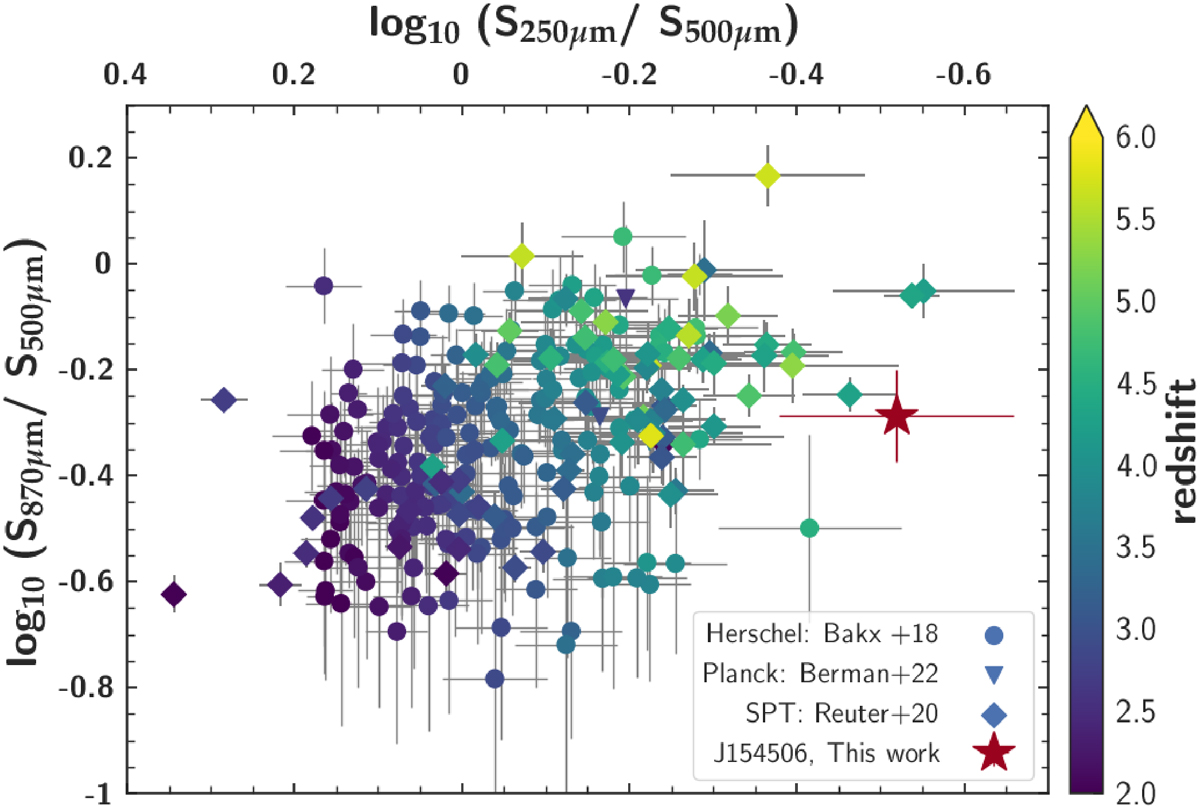
Far-infrared and submm colour-colour diagram (S870 μm/S500 μm vs. S250 μm/S500 μm), colour-coded by redshift. The brightest known sources from the Herschel, Planck, and SPT surveys are shown with circular, triangular, and rhomboidal symbols, respectively. J154506 is highlighted with a red star. Flux densities at 850 μm (rather than at 870 μm) are used for the Herschel and Planck sources. The extremely red S250 μm/S500 μm colour of J154506 suggests a redshift of z > 3.
Current usage metrics show cumulative count of Article Views (full-text article views including HTML views, PDF and ePub downloads, according to the available data) and Abstracts Views on Vision4Press platform.
Data correspond to usage on the plateform after 2015. The current usage metrics is available 48-96 hours after online publication and is updated daily on week days.
Initial download of the metrics may take a while.