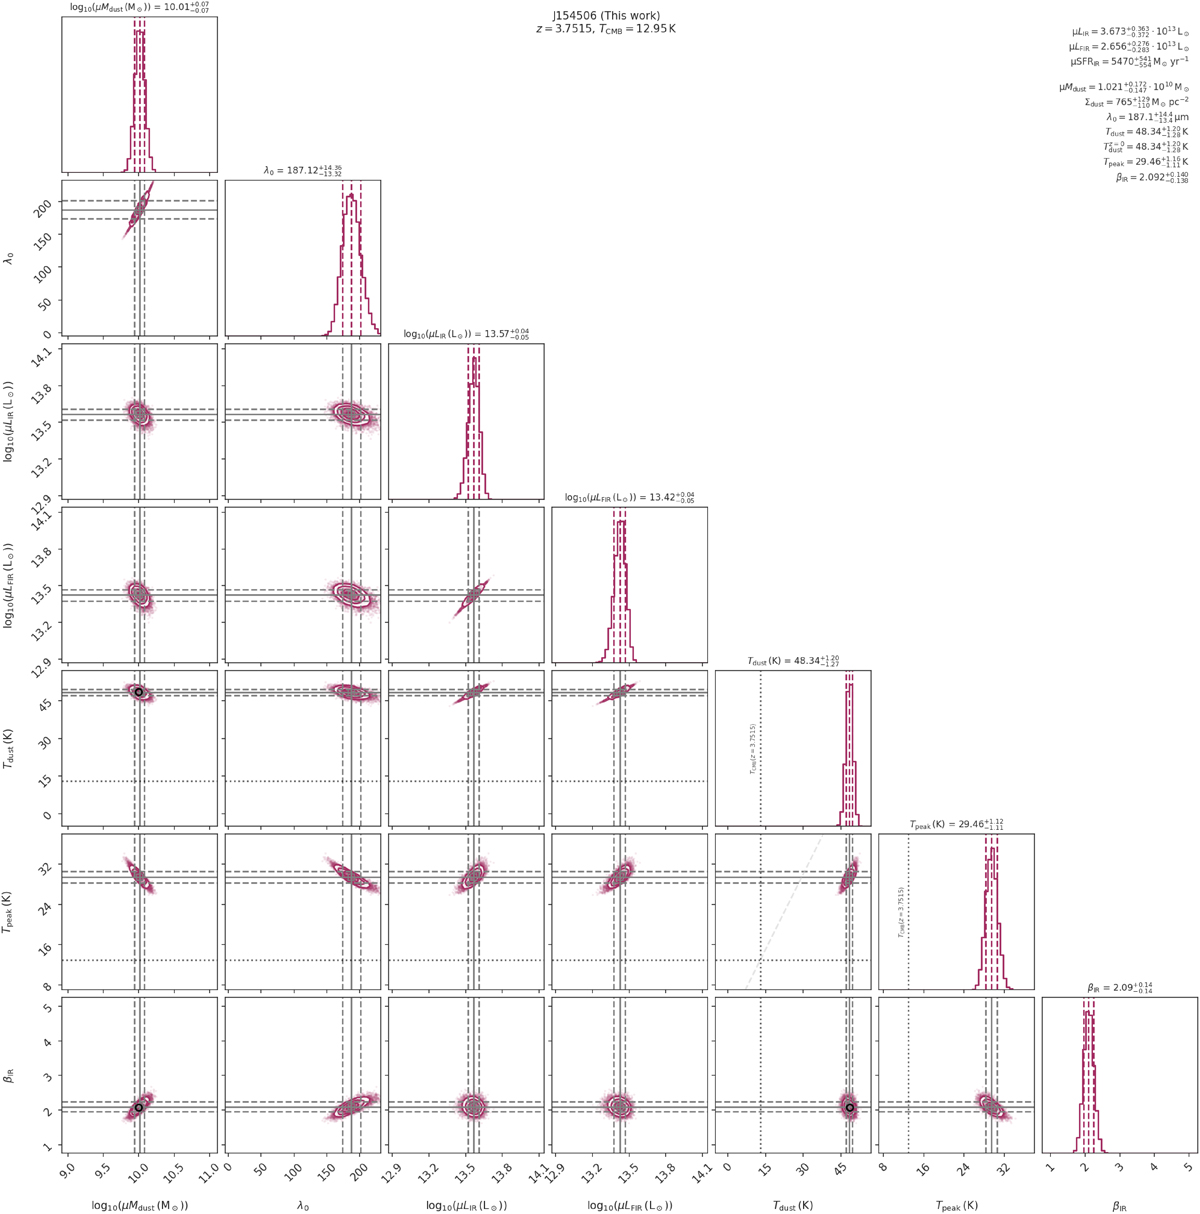
Fig. F.1.
Download original image
Corner plot of the posterior distribution obtained from the MERCURIUS FIR fitting for J154506 at z = 3.7515 shown in Fig. 6 before correcting for magnification under a self-consistent scenario. Derived values for the dust mass (Mdust), opacity transition wavelength (λ0), dust temperature (Tdust), and dust emissivity index (βIR) are shown. Solid grey lines indicate the median (i.e. 50th percentile) of the parameter’s marginalised posterior distribution, while dashed lines show the 16th and 84th percentiles. In panels with the dust temperature, a dotted line indicates TCMB at the redshift of J154506 (TCMB = 12.95 K). We note that the total IR luminosity (LIR) is not an independent parameter of the fitting routine, and is included purely for visualisation purposes.
Current usage metrics show cumulative count of Article Views (full-text article views including HTML views, PDF and ePub downloads, according to the available data) and Abstracts Views on Vision4Press platform.
Data correspond to usage on the plateform after 2015. The current usage metrics is available 48-96 hours after online publication and is updated daily on week days.
Initial download of the metrics may take a while.