Fig. 2.
Download original image
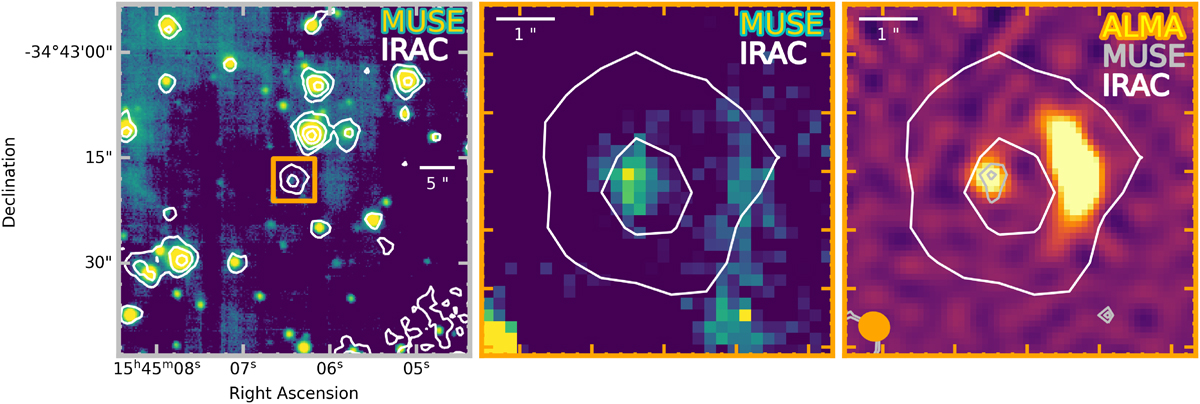
Left panel: Multi Unit Spectroscopic Explorer (MUSE) white-light (4750–9350 Å) median stack image of a 50 × 50″ region centred on the lens coordinates, with the orange square representing a 3 × 3″ region. The 1, 2, 5, and 10σ Infrared Array Camera (IRAC) contours are shown in white. Central panel: 6 × 6″ MUSE zoom-in with the 1 and 2σ IRAC white contours overlaid. Both IRAC and MUSE images are aligned using Gaia-DR3 stars within a 30″ radius circle around the source. The faint linear emission feature does not overlap with the ALMA main arc, but instead corresponds to the noise arising from the ‘gaps’ between the MUSE detectors. Right panel: Same as the central panel, but overlaid on the ALMA Band 7 image of the background galaxy at 0.75″ resolution (robust = 1). The IRAC and MUSE 1 and 2σ contours are shown in white and grey, respectively, to illustrate the relative position of the lens with respect to the background galaxy in the image plane.
Current usage metrics show cumulative count of Article Views (full-text article views including HTML views, PDF and ePub downloads, according to the available data) and Abstracts Views on Vision4Press platform.
Data correspond to usage on the plateform after 2015. The current usage metrics is available 48-96 hours after online publication and is updated daily on week days.
Initial download of the metrics may take a while.