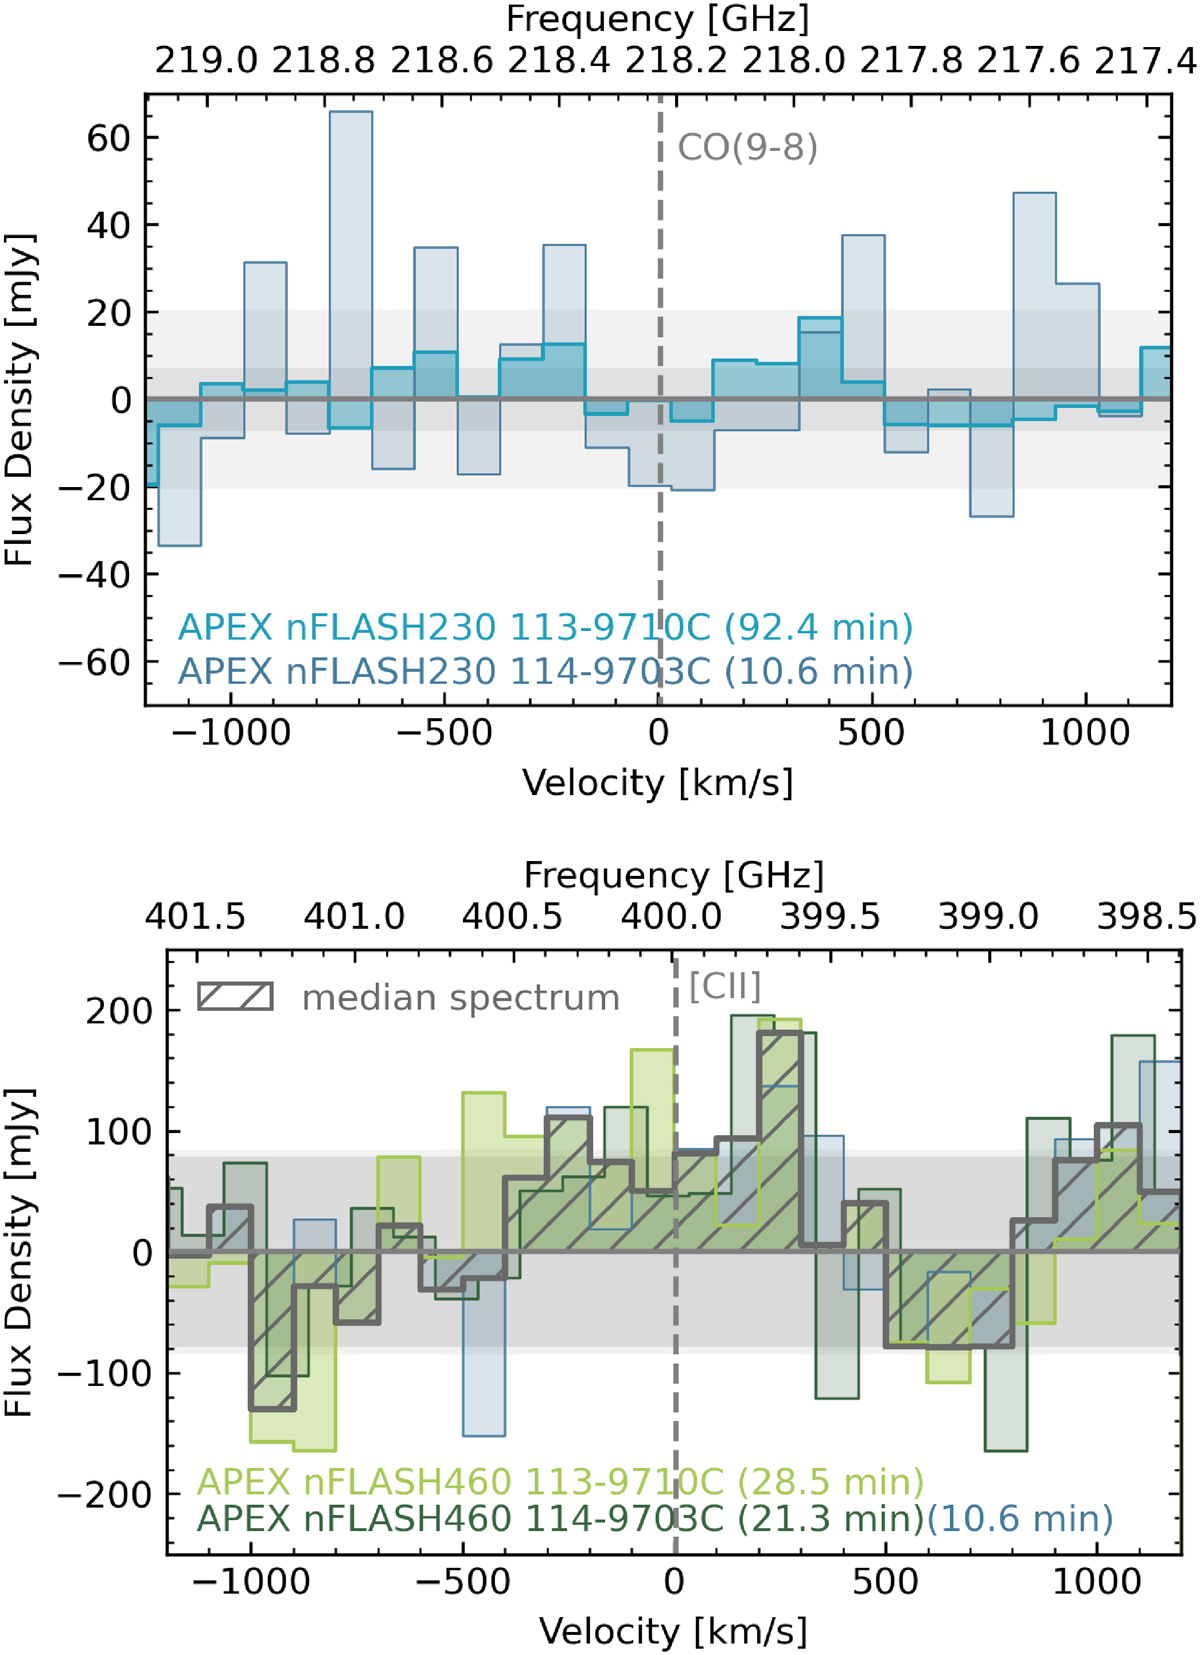
Fig. 4.
Download original image
Spectra from APEX nFLASH230 (top panel) and nFLASH460 (bottom panel), centred at the redshifted (z = 3.7515) frequencies of the CO(9-8) and [CII] emission lines, respectively. The independent runs are colour-coded and labelled accordingly. The derived RMS (1σ noise level) is indicated by light grey shading, while dark grey arises from the overlap region of the errors from distinct datasets. The CO(9-8) line is not detected, but [CII] is detected at > 2 sigma in all three scans. For [CII], the median-averaged spectrum (S/N > 4) is shown in dark grey, with the area shaded using diagonal grey hatching.
Current usage metrics show cumulative count of Article Views (full-text article views including HTML views, PDF and ePub downloads, according to the available data) and Abstracts Views on Vision4Press platform.
Data correspond to usage on the plateform after 2015. The current usage metrics is available 48-96 hours after online publication and is updated daily on week days.
Initial download of the metrics may take a while.