Fig. 5.
Download original image
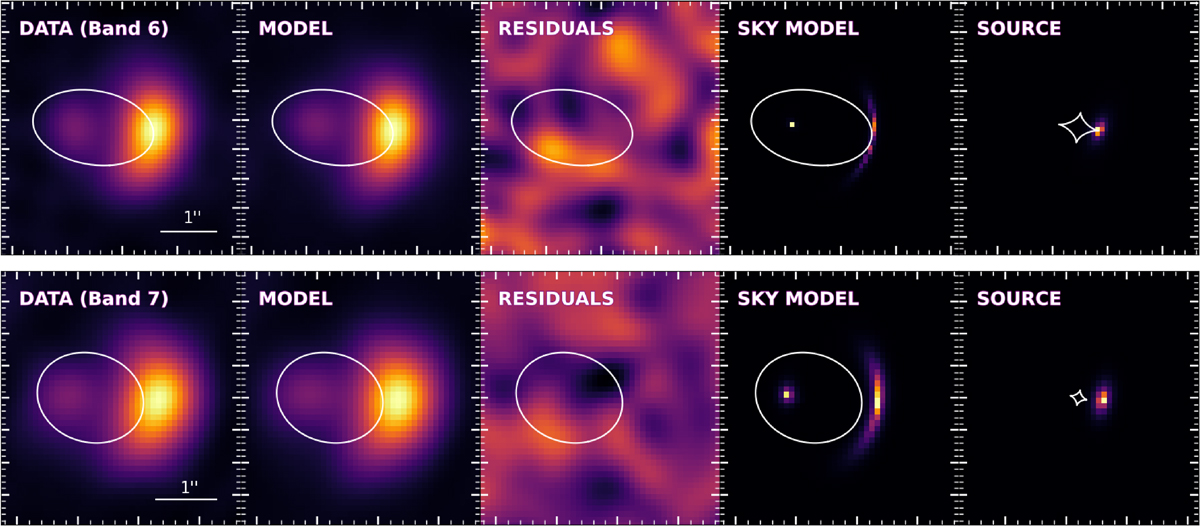
Results from the lens modelling analysis in the uv-plane for B6 (top) and B7 (bottom). From left to right: the panels show the ‘dirty’ data image, ‘dirty’ model image, ‘dirty’ residuals, sky model (i.e. deconvolved), and source model. The white line represents the critical curve (first four panels) and the caustic curve (rightmost panel).
Current usage metrics show cumulative count of Article Views (full-text article views including HTML views, PDF and ePub downloads, according to the available data) and Abstracts Views on Vision4Press platform.
Data correspond to usage on the plateform after 2015. The current usage metrics is available 48-96 hours after online publication and is updated daily on week days.
Initial download of the metrics may take a while.