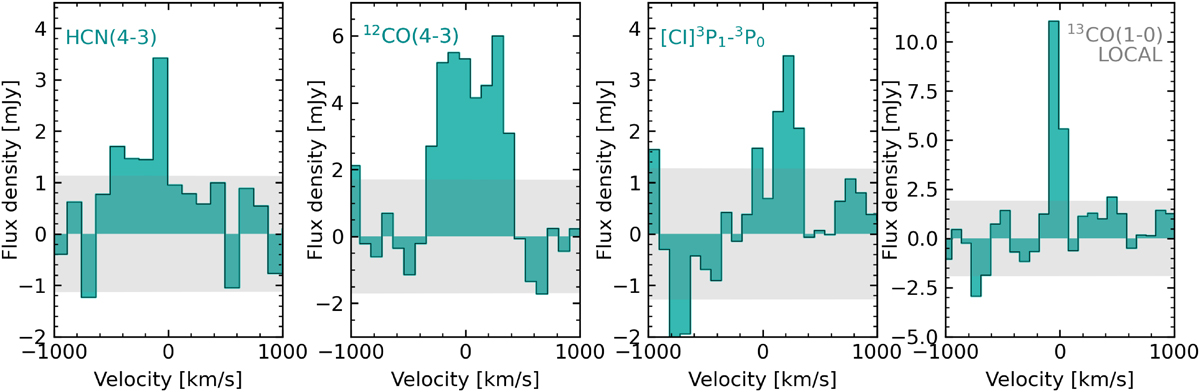
Fig. B.1.
Download original image
LMT/RSR spectra at their native (unbinned) resolution at the position of the detected lines at z = 3.5715 (three first panels; HCN(4-3), 12CO(4-3), and [CI]3P1-3P0 from left to right) and the Lupus molecular cloud (right panel; local 13CO(1-0)). Note that the peak flux density is slightly higher than for the binned spectrum shown in the bottom panel of Figure 3.
Current usage metrics show cumulative count of Article Views (full-text article views including HTML views, PDF and ePub downloads, according to the available data) and Abstracts Views on Vision4Press platform.
Data correspond to usage on the plateform after 2015. The current usage metrics is available 48-96 hours after online publication and is updated daily on week days.
Initial download of the metrics may take a while.