Fig. 9.
Download original image
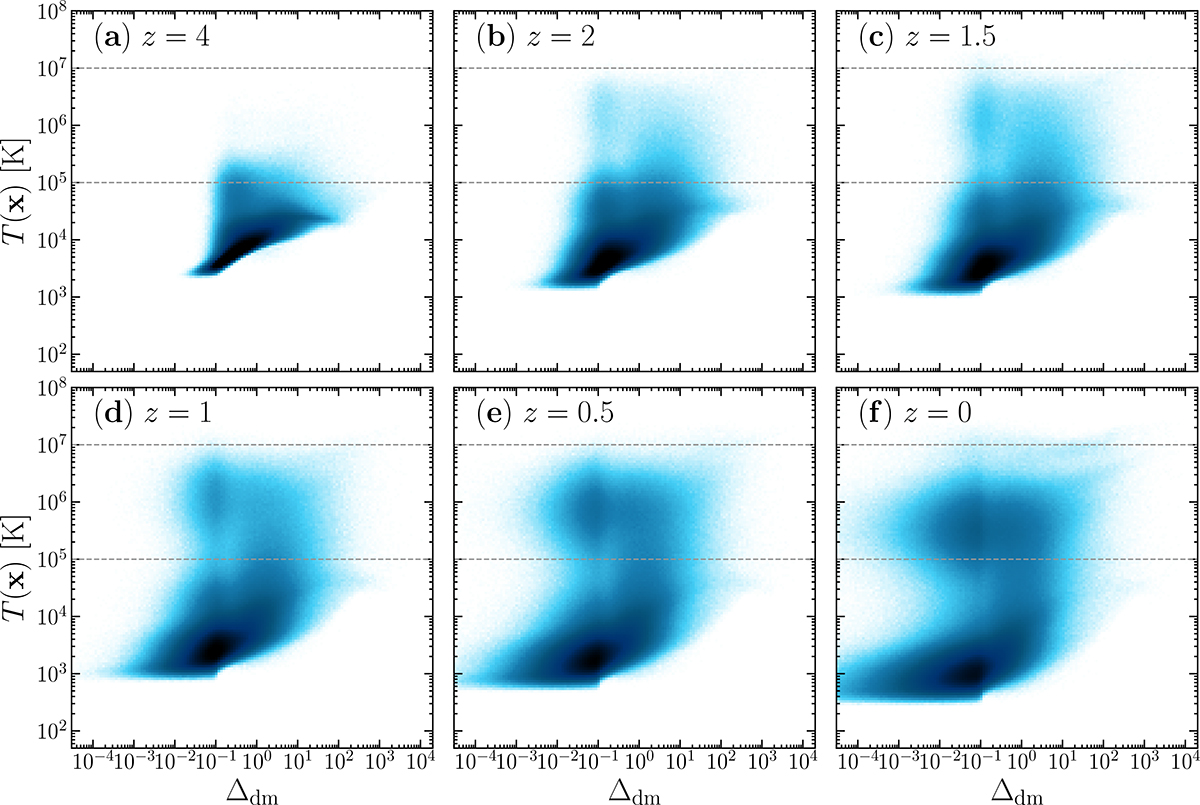
Scatter plot of temperature for baryonic gas as a function of dark matter density. Panels (a)–(f) are for z = 4–0, respectively. Gas with T < 105 K is the warm gas, gas with T > 107 K is the hot gas, and gas with temperatures between these two ranges is the WHIM. Note that regions of temperature below 104 K in the TNG data are not well resolved, particularly for the cells of star-forming gas (see Springel & Hernquist 2003), and should be interpreted with caution.
Current usage metrics show cumulative count of Article Views (full-text article views including HTML views, PDF and ePub downloads, according to the available data) and Abstracts Views on Vision4Press platform.
Data correspond to usage on the plateform after 2015. The current usage metrics is available 48-96 hours after online publication and is updated daily on week days.
Initial download of the metrics may take a while.