Fig. 11
Download original image
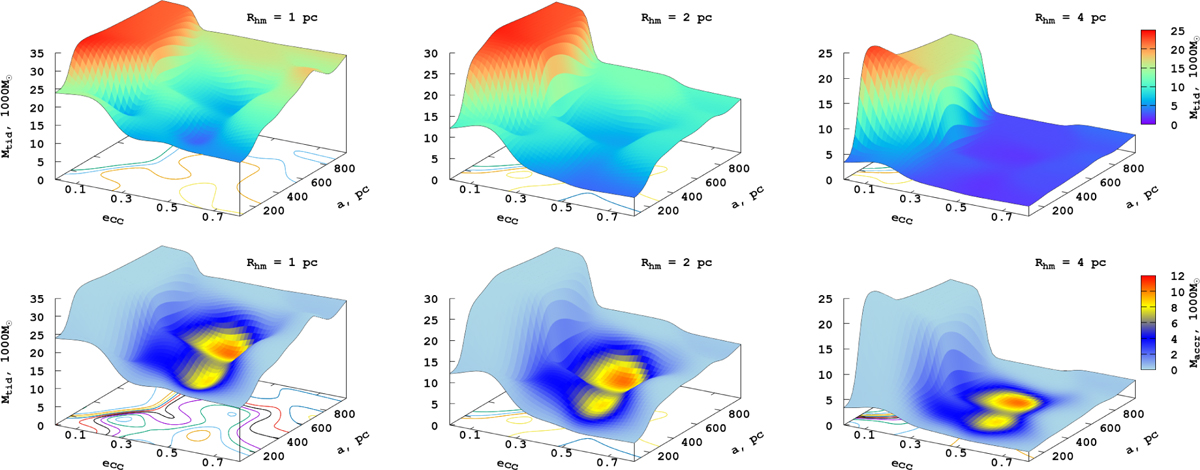
Global tidal mass loss and accretion mass maps over all our theoretical GC models. The X and Y axes are the orbital parameters of our GC’s. The Z axis is a tidal mass of the clusters after 5 Gyr of dynamical integration. In the bottom row, the colour-coding corresponds to the accreted mass onto proto-NSC from the individual clusters.
Current usage metrics show cumulative count of Article Views (full-text article views including HTML views, PDF and ePub downloads, according to the available data) and Abstracts Views on Vision4Press platform.
Data correspond to usage on the plateform after 2015. The current usage metrics is available 48-96 hours after online publication and is updated daily on week days.
Initial download of the metrics may take a while.