Open Access
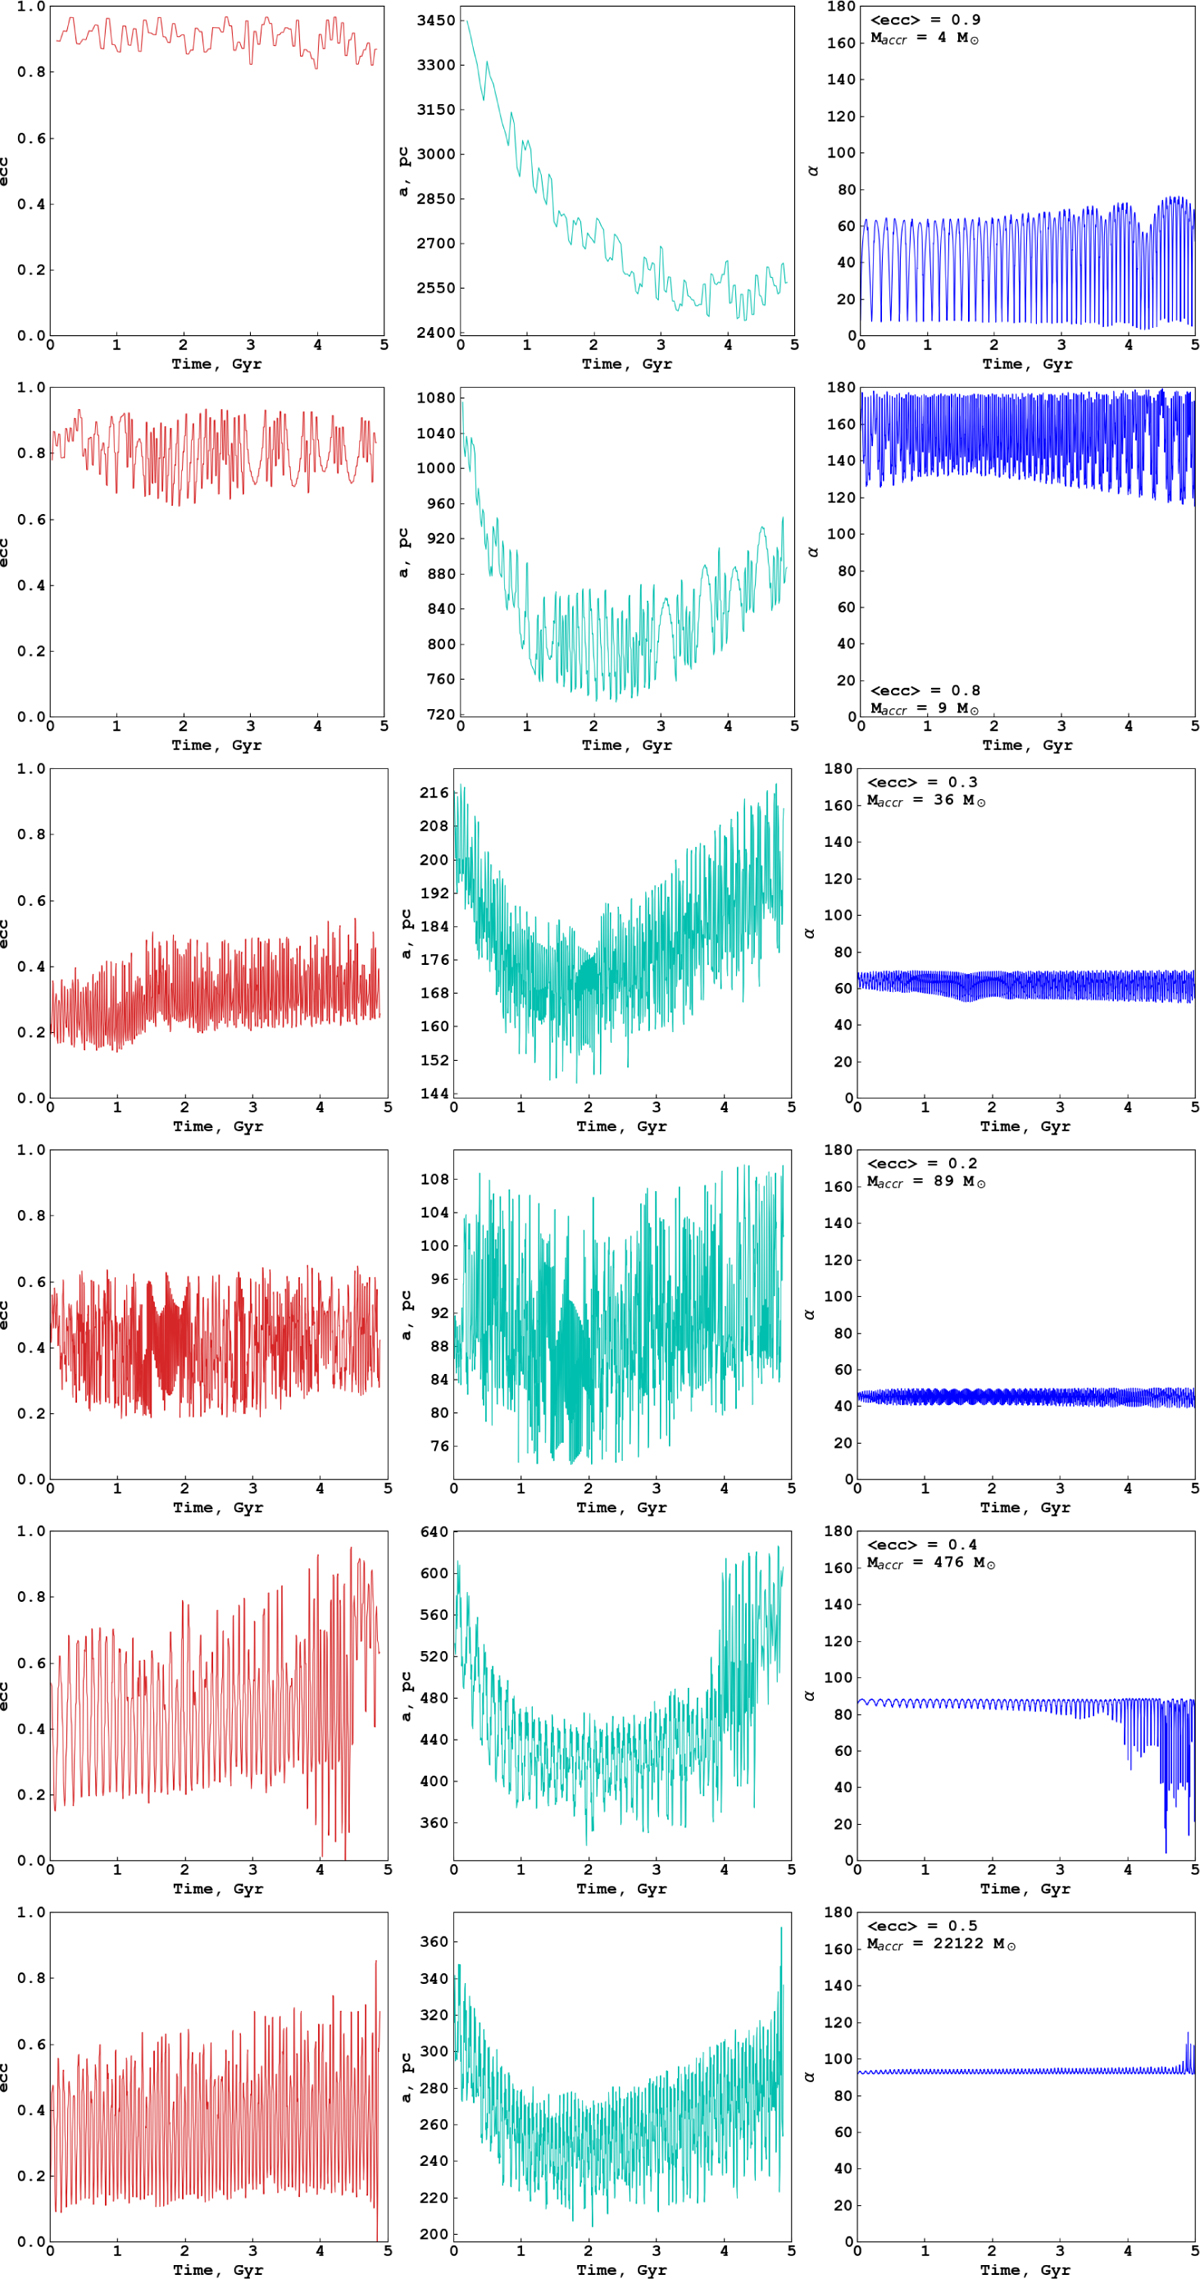
Fig. C.1
Download original image
Evolution of the orbital parameters ecc, a, and α over 5 Gyr of GCs simulation.
First two plots represent models with accretion less then 10 M⊙, two middle panels – 10−100 M⊙ and two bottom – more than 100 M⊙.
Current usage metrics show cumulative count of Article Views (full-text article views including HTML views, PDF and ePub downloads, according to the available data) and Abstracts Views on Vision4Press platform.
Data correspond to usage on the plateform after 2015. The current usage metrics is available 48-96 hours after online publication and is updated daily on week days.
Initial download of the metrics may take a while.