Fig. D.3
Download original image
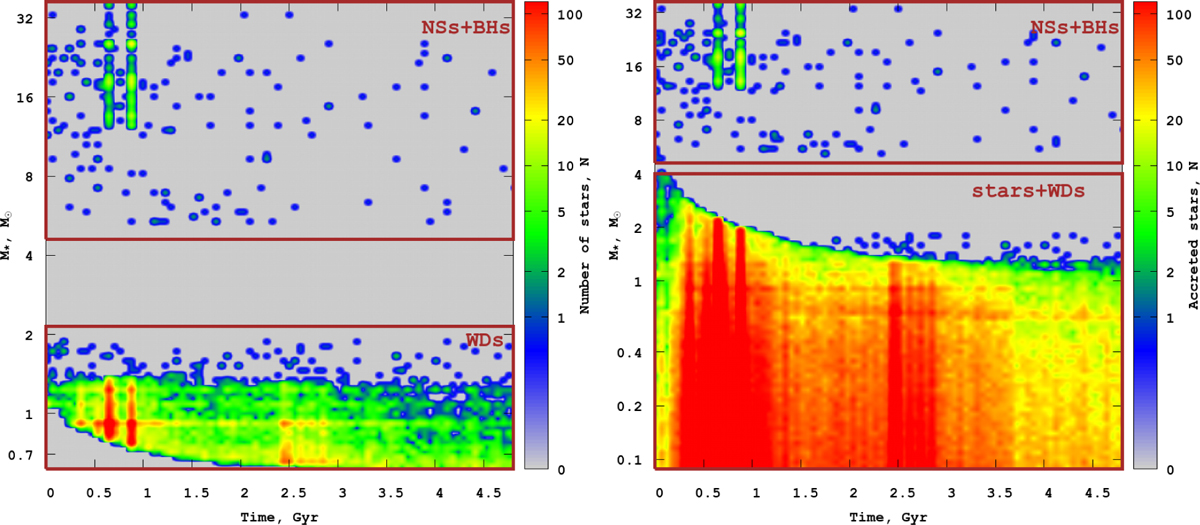
Stellar remnants accretion rate onto the NSC for 50 GCs models for rhm=2 pc. Left: the mass-time distribution for stellar remnants (WDs, NSs, and BHs); right: for all stars. From the left graph, the boundary between white dwarfs at the bottom and neutron stars and black holes at the top is clearly visible (compact object mass gap). It is also clearly seen in the right figure that the main accretion number contribution comes from low-mass stars, approximately up to ∼ 1.4 solar masses (according to the Chandrasekhar limit).
Current usage metrics show cumulative count of Article Views (full-text article views including HTML views, PDF and ePub downloads, according to the available data) and Abstracts Views on Vision4Press platform.
Data correspond to usage on the plateform after 2015. The current usage metrics is available 48-96 hours after online publication and is updated daily on week days.
Initial download of the metrics may take a while.