Fig. 2
Download original image
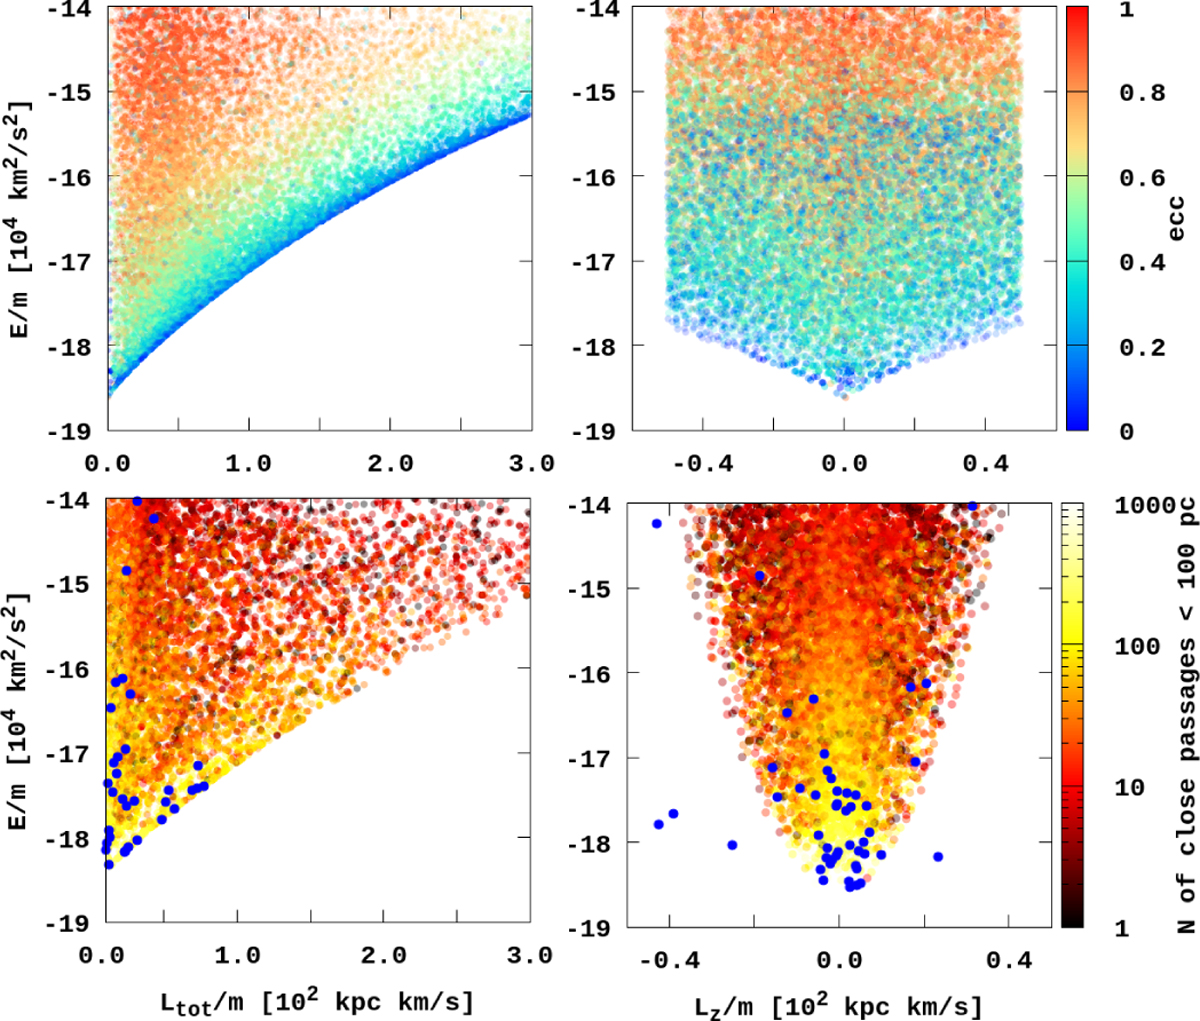
Distribution of the GCs in phase space: E vs Ltot, and E vs Lz in 411321 external potential. Top: initial phase space distribution, where the colour-coding shows orbital mean ecc, based on 5 Gyr of integration. Bottom: interactions (close passages) with the GalC, based on 5 Gyr of integration. Colour-coding represents the number of such events. Black dots represent selected GCs for future N-body simulations.
Current usage metrics show cumulative count of Article Views (full-text article views including HTML views, PDF and ePub downloads, according to the available data) and Abstracts Views on Vision4Press platform.
Data correspond to usage on the plateform after 2015. The current usage metrics is available 48-96 hours after online publication and is updated daily on week days.
Initial download of the metrics may take a while.