Open Access
Fig. 2.
Download original image
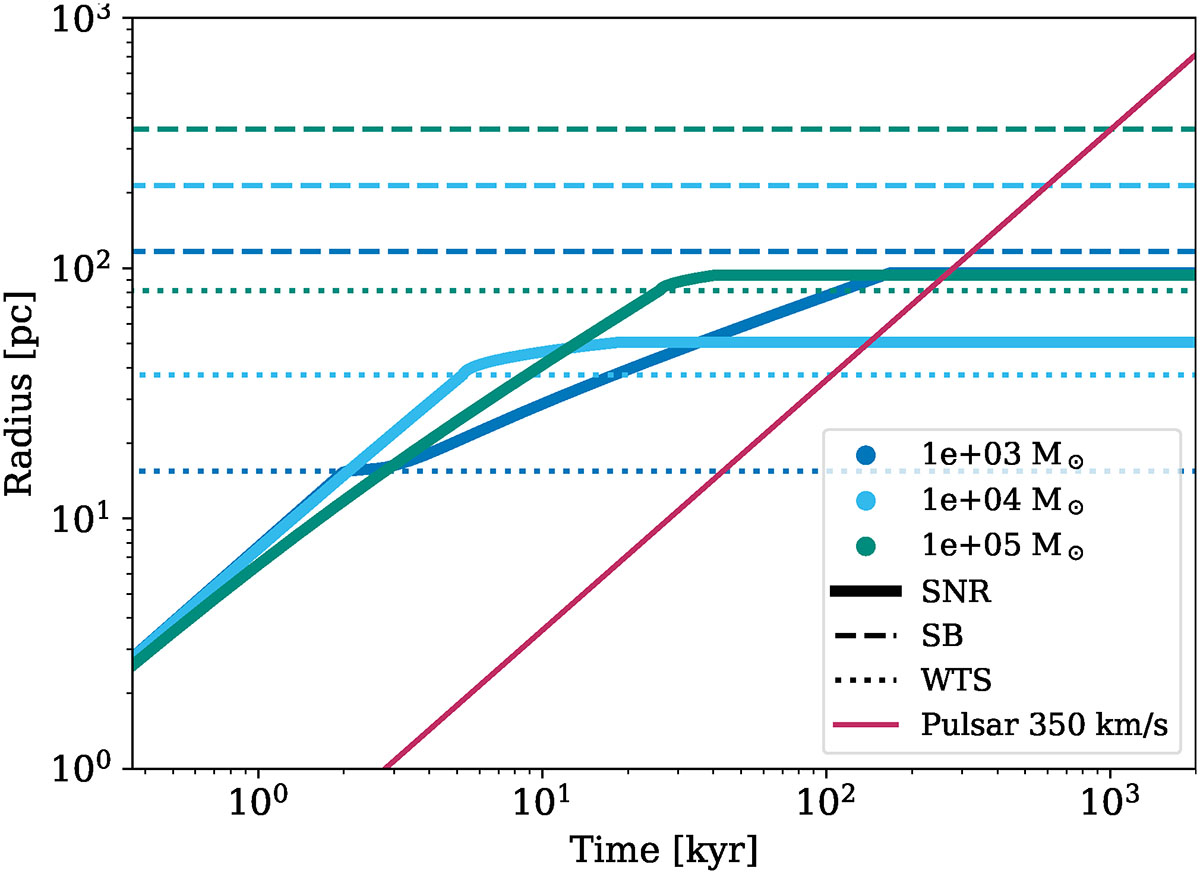
Evolution of the SNR as a function of time in the SB scenario, for a stellar progenitor of initial mass 8 M⊙ and three different masses of the stellar cluster it belongs to. Graphical elements are similar to Fig. 1. The SNR curves turn flat when the remnant merges with the cavity interior and disappears.
Current usage metrics show cumulative count of Article Views (full-text article views including HTML views, PDF and ePub downloads, according to the available data) and Abstracts Views on Vision4Press platform.
Data correspond to usage on the plateform after 2015. The current usage metrics is available 48-96 hours after online publication and is updated daily on week days.
Initial download of the metrics may take a while.