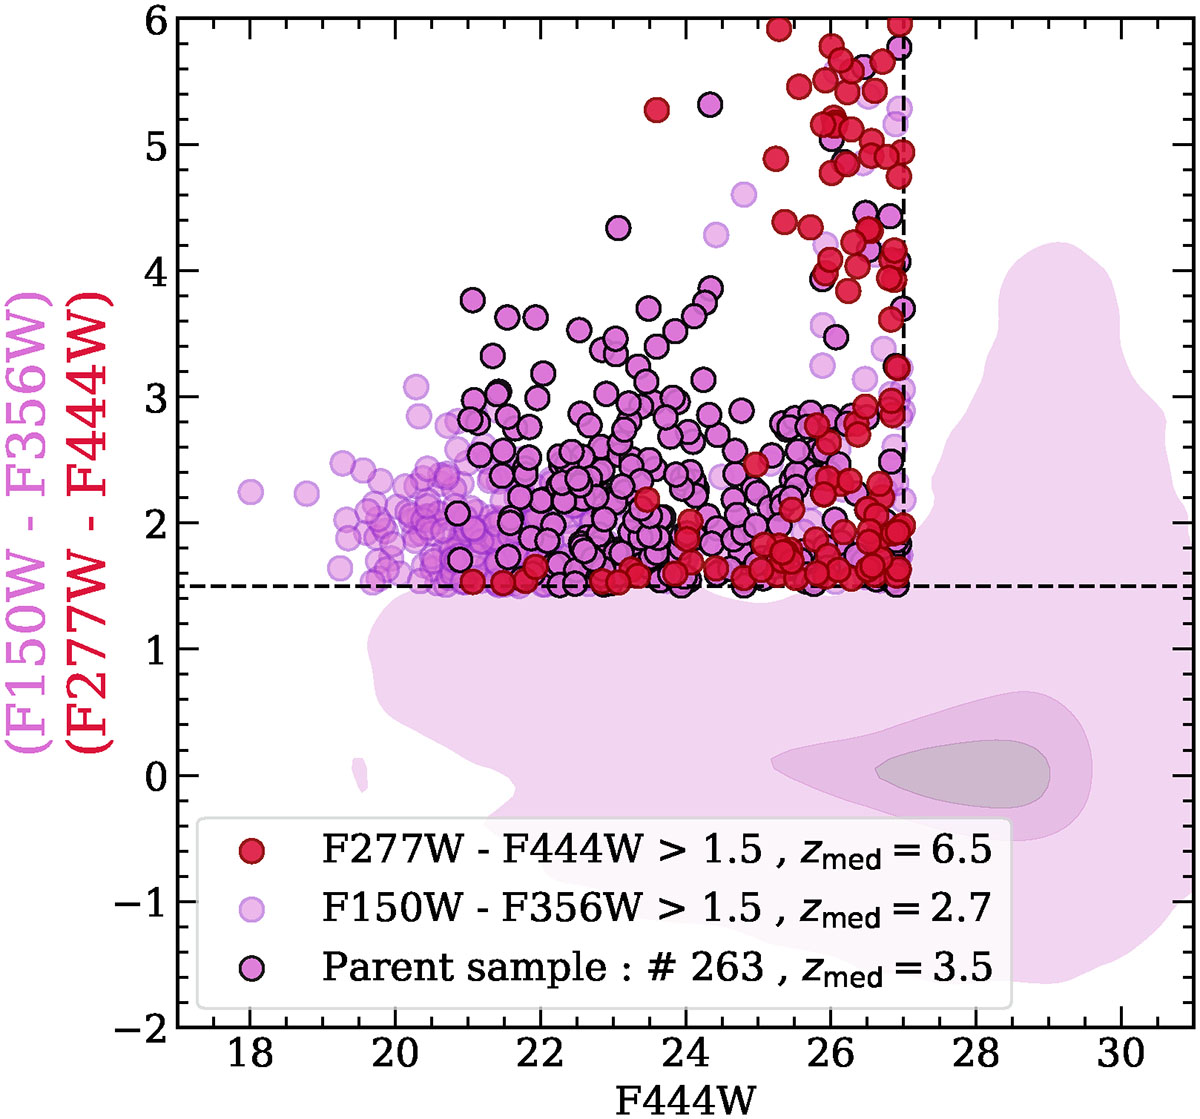
Fig. 1.
Download original image
Color-magnitude diagram illustrating the parent sample: in purple we show the sources that respect the color-magnitude criterion, and black edges denote the parent sample, respecting z > 2.5. In red, we show the color-magnitude selection for the red color of LRDs F277W – F444W > 1.5 used in Akins et al. (2025b), having a zmedian ≈ 6.5. Red and purple contours represent all CEERS sources at 25%, 50% and 80% levels shown for F150W-F356W.
Current usage metrics show cumulative count of Article Views (full-text article views including HTML views, PDF and ePub downloads, according to the available data) and Abstracts Views on Vision4Press platform.
Data correspond to usage on the plateform after 2015. The current usage metrics is available 48-96 hours after online publication and is updated daily on week days.
Initial download of the metrics may take a while.