Fig. 11.
Download original image
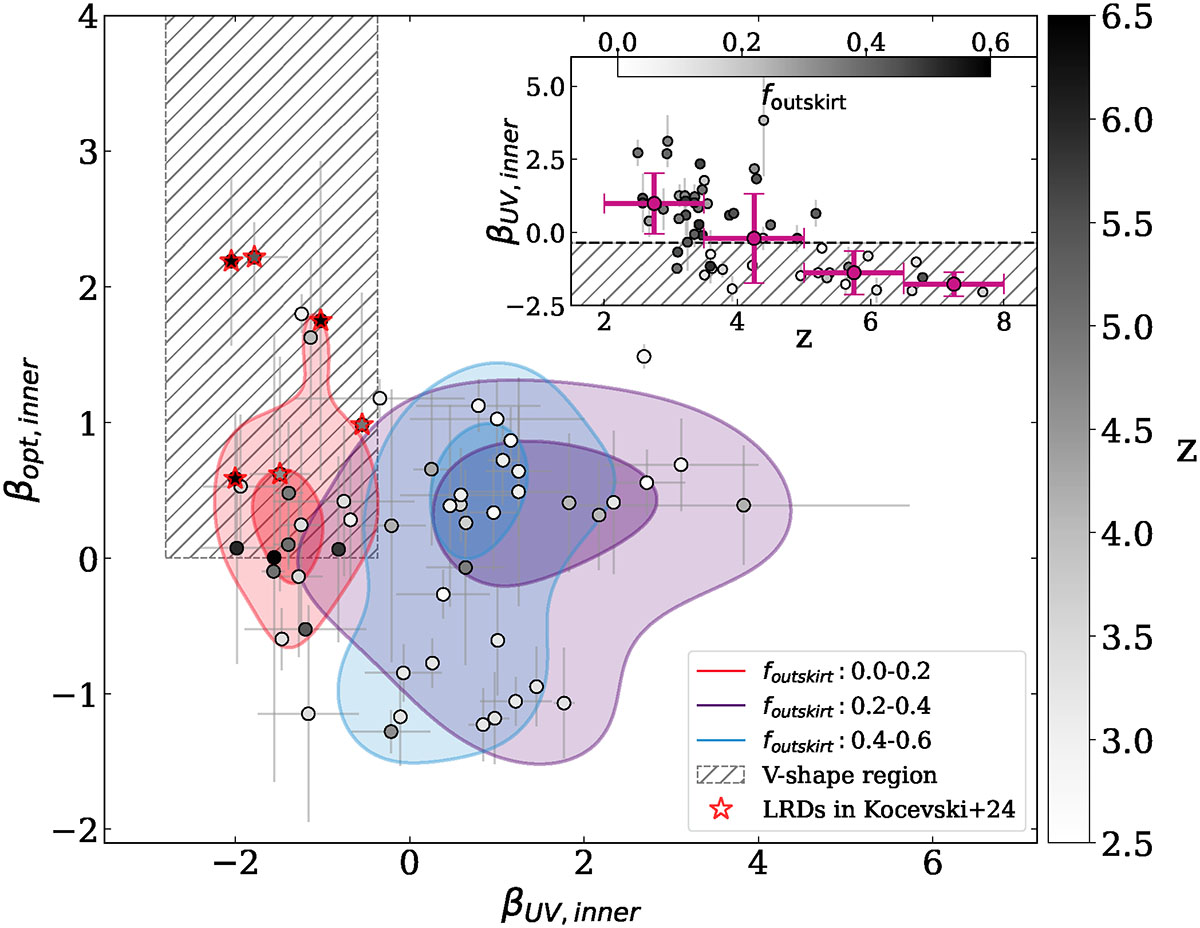
βUV/βopt plane of the inner regions of the sample. The fraction of the mass outskirt is represented by contours with 0.4 and 0.8 levels, increasing from red to purple and blue. Redshift is indicated by a gray color bar. The LRD selection from Kocevski et al. (2025) is shown in the light gray dashed region and LRDs in common are shown in red stars. In the top right-hand corner, we show βUV,inner as a function of redshift, the colorbar denotes the mass fraction of the outskirt foutskirt, the shaded region refers to the V shape selection.
Current usage metrics show cumulative count of Article Views (full-text article views including HTML views, PDF and ePub downloads, according to the available data) and Abstracts Views on Vision4Press platform.
Data correspond to usage on the plateform after 2015. The current usage metrics is available 48-96 hours after online publication and is updated daily on week days.
Initial download of the metrics may take a while.