Fig. 12.
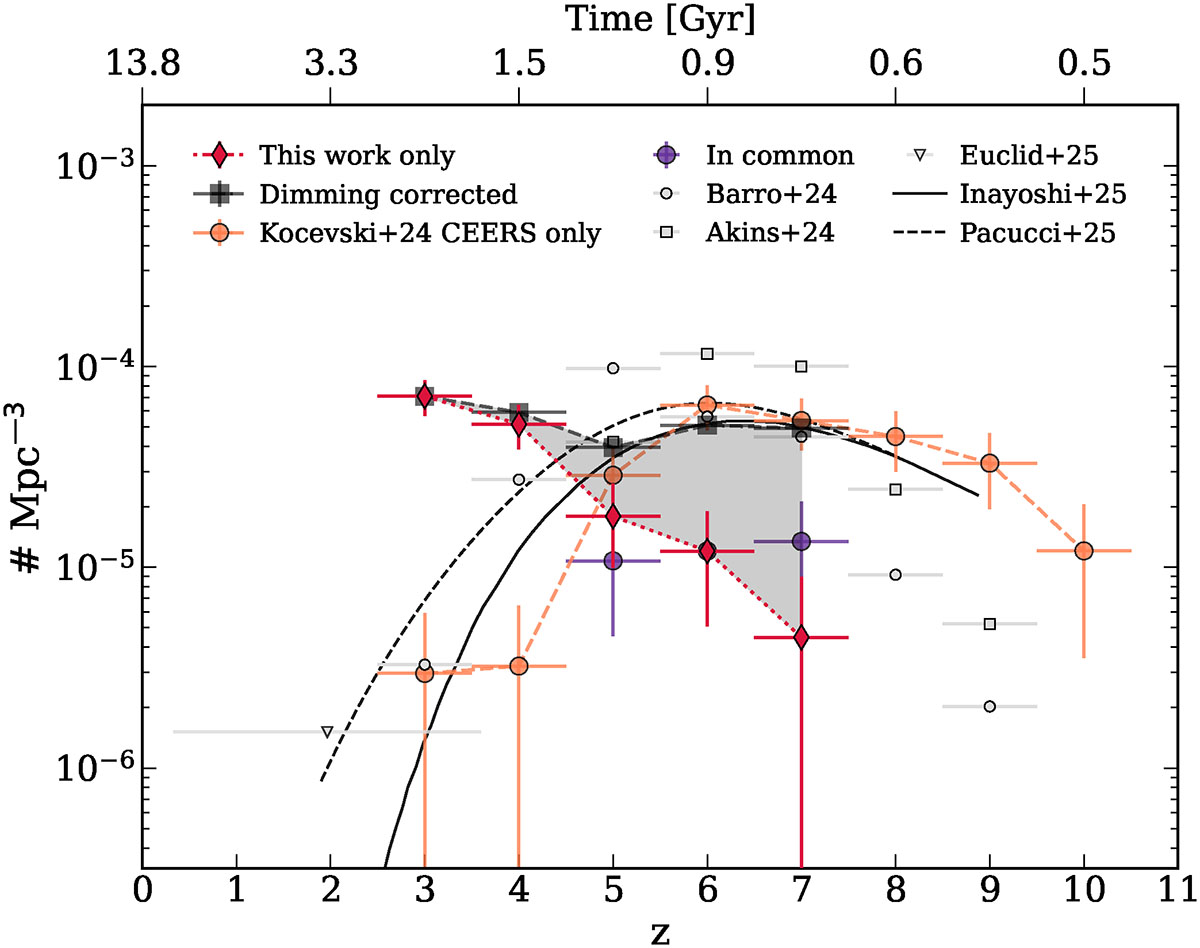
Download original image
Number density as a function of redshift from our sample visible in red, excluding the six common sources with the LRDs in CEERS from Kocevski et al. (2025), here shown in orange. In purple, the number density of the sources in both samples is shown. The dimming-corrected number density of our sample is shown with dark gray square symbols, interpreted as an upper limit. LRDs from Akins et al. (2025b), Barro et al. (2024a), and Euclid Collaboration: Bisigello et al. (2026) are represented by light gray squares, circles, and triangles, respectively. Horizontal error bars indicate the redshift bins used to compute the number density, and vertical error bars represent Poissonian errors. The theoretical evolution from Pacucci & Loeb (2025) is shown as the dashed black line, while the solid line refers to the model of Inayoshi (2025).
Current usage metrics show cumulative count of Article Views (full-text article views including HTML views, PDF and ePub downloads, according to the available data) and Abstracts Views on Vision4Press platform.
Data correspond to usage on the plateform after 2015. The current usage metrics is available 48-96 hours after online publication and is updated daily on week days.
Initial download of the metrics may take a while.