Fig. 2.
Download original image
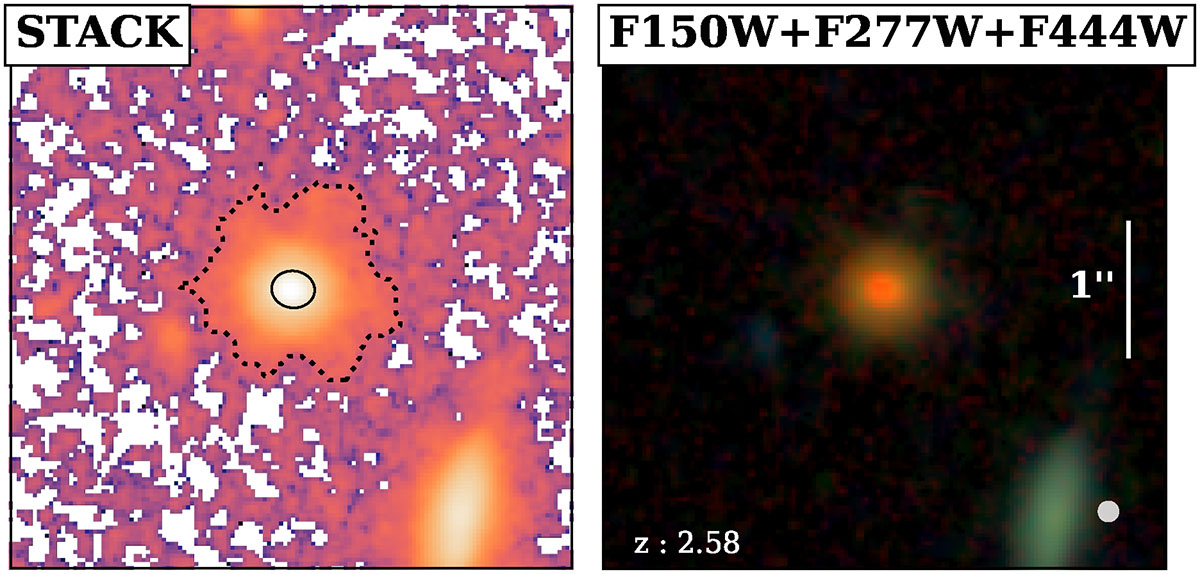
Example illustrating the definition of the outskirts and inner regions. Left panel: stacked image combining all JWST bands, defined as STACK = F115W + F150W + F200W + F277W + F356W + F410M + F444W, using PSF-matched data. The dotted line shows the segmentation map, while the solid line traces the ellipse with a semi-major axis of 0.16″ = 2HWHM. Right panel: color composite image using F150W (blue), F277W (green), and F444W (red). The white circle indicates the PSF FWHM beam at F444W. As expected, the galaxy exhibits a centrally concentrated red emission and a bluer, more extended periphery.
Current usage metrics show cumulative count of Article Views (full-text article views including HTML views, PDF and ePub downloads, according to the available data) and Abstracts Views on Vision4Press platform.
Data correspond to usage on the plateform after 2015. The current usage metrics is available 48-96 hours after online publication and is updated daily on week days.
Initial download of the metrics may take a while.