Fig. 8.
Download original image
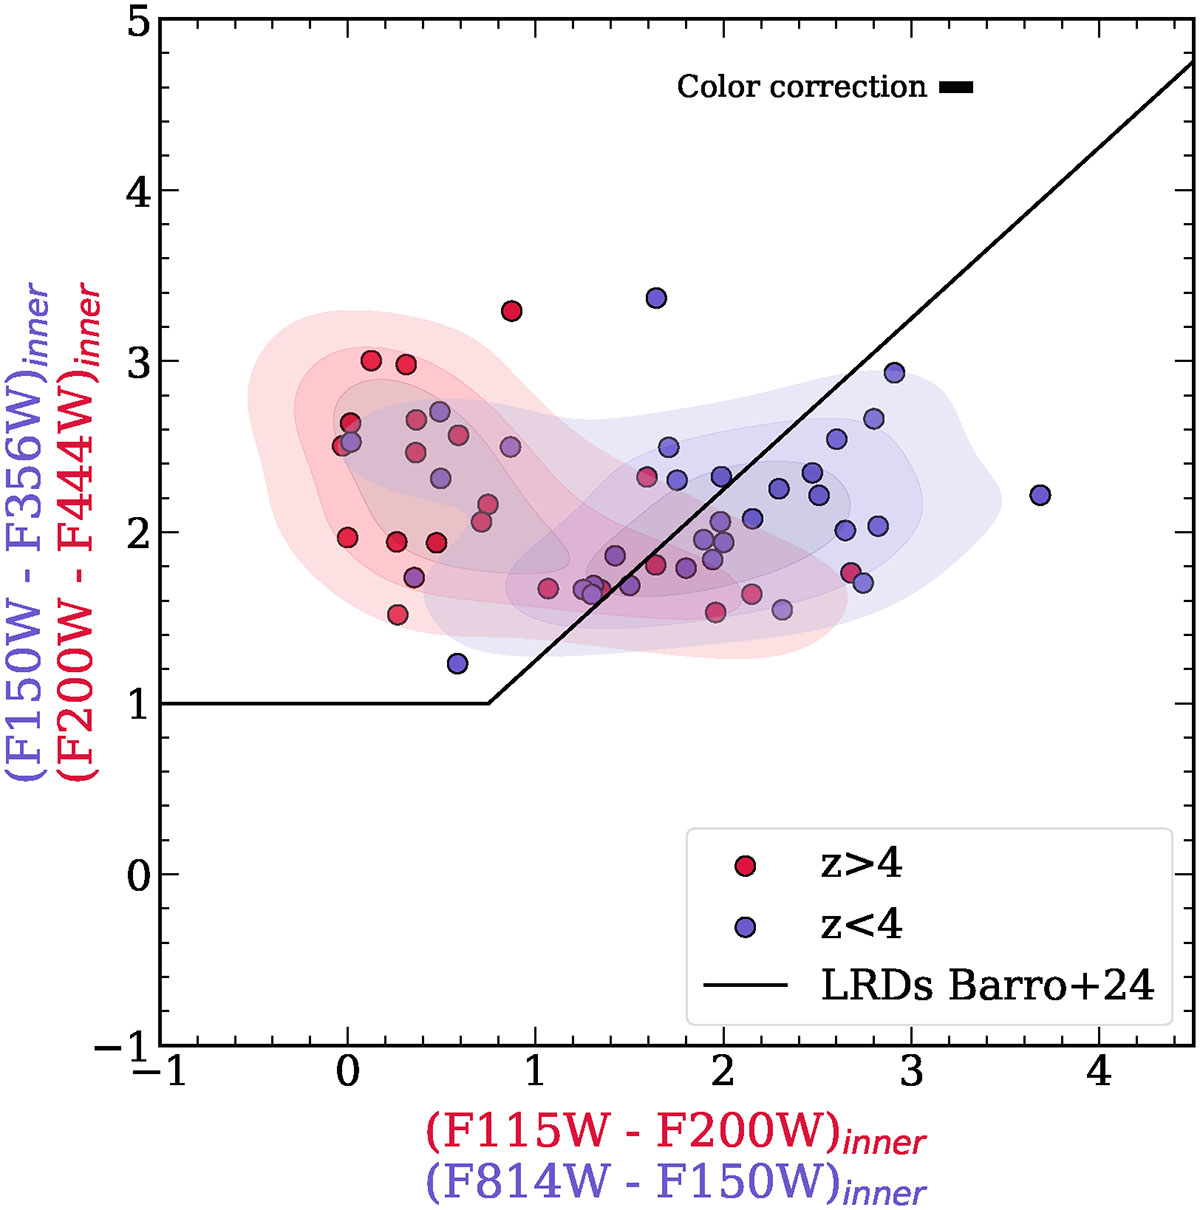
Color–color selection of LRDs described in Barro et al. (2024a), originally defined for galaxies at z > 4, applied to the inner regions of our sample at z > 4 (shown in red). For galaxies at z < 4, the same rest-frame colors are probed by shifting the bands accordingly (shown in blue). Contours represent the 25%, 50%, and 75% density levels for each distribution. The applied color correction is indicated by a thick black line, with an average shift of ≈0.2 mag.
Current usage metrics show cumulative count of Article Views (full-text article views including HTML views, PDF and ePub downloads, according to the available data) and Abstracts Views on Vision4Press platform.
Data correspond to usage on the plateform after 2015. The current usage metrics is available 48-96 hours after online publication and is updated daily on week days.
Initial download of the metrics may take a while.