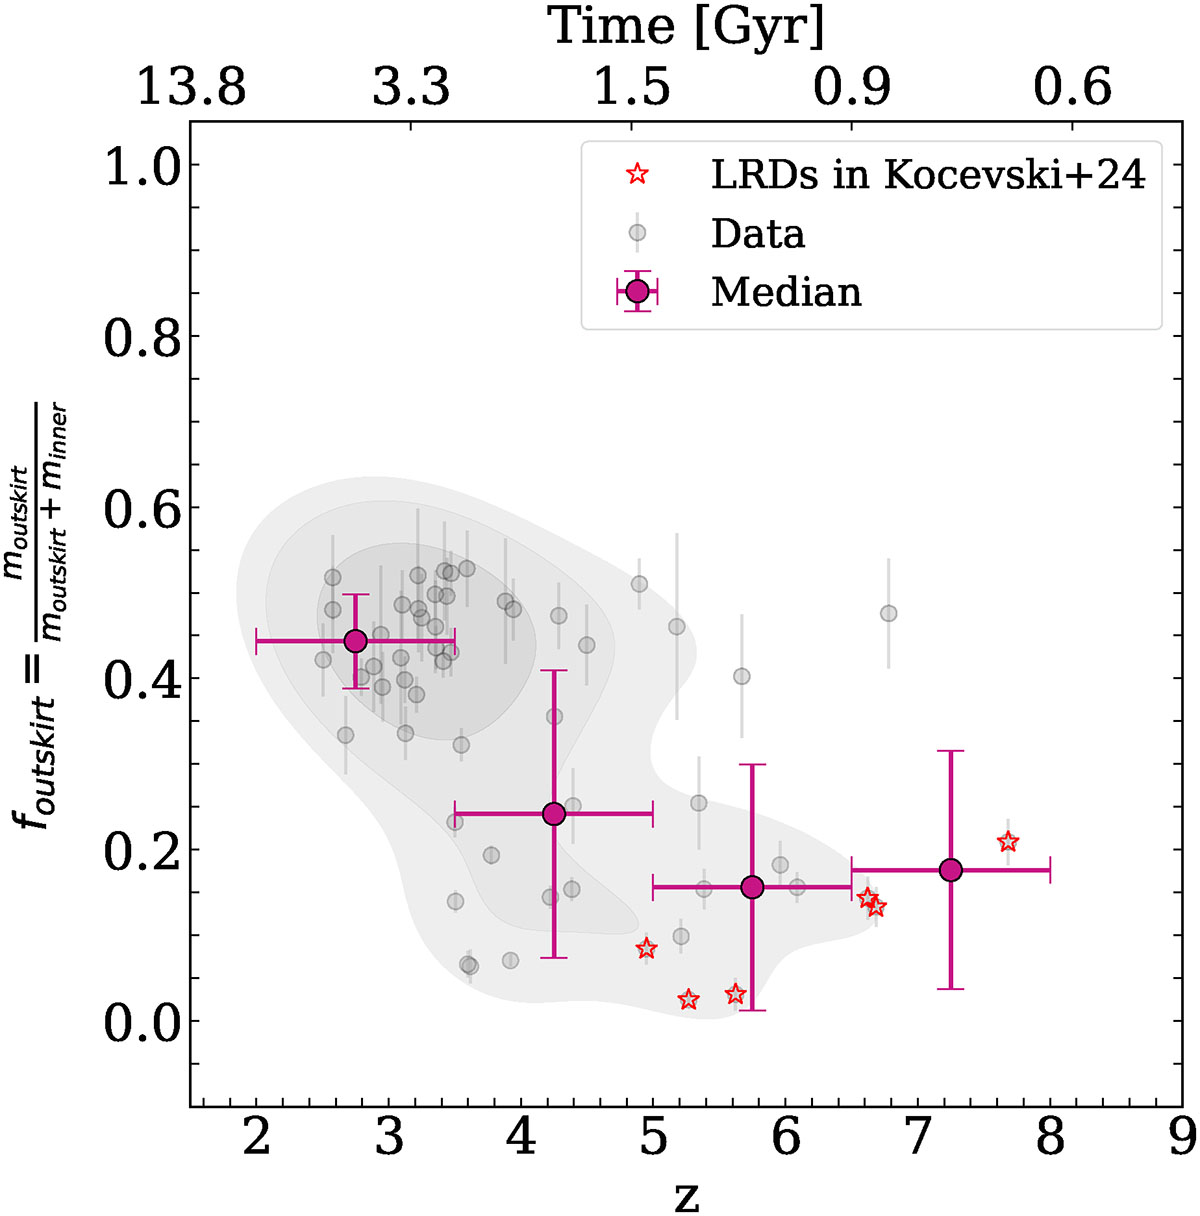
Fig. 9.
Download original image
Outskirts’ mass fraction as a function of redshift. Gray dots represent the data, while gray contours illustrate their distribution at 0.25, 0.5 and 0.75 levels. The median is shown as a purple circle, with each point computed in bins of Δz = 1. Vertical error bars indicate the standard deviation, while horizontal bars represent the width within each bin. Red stars refer to the LRDs also in Kocevski et al. (2025).
Current usage metrics show cumulative count of Article Views (full-text article views including HTML views, PDF and ePub downloads, according to the available data) and Abstracts Views on Vision4Press platform.
Data correspond to usage on the plateform after 2015. The current usage metrics is available 48-96 hours after online publication and is updated daily on week days.
Initial download of the metrics may take a while.