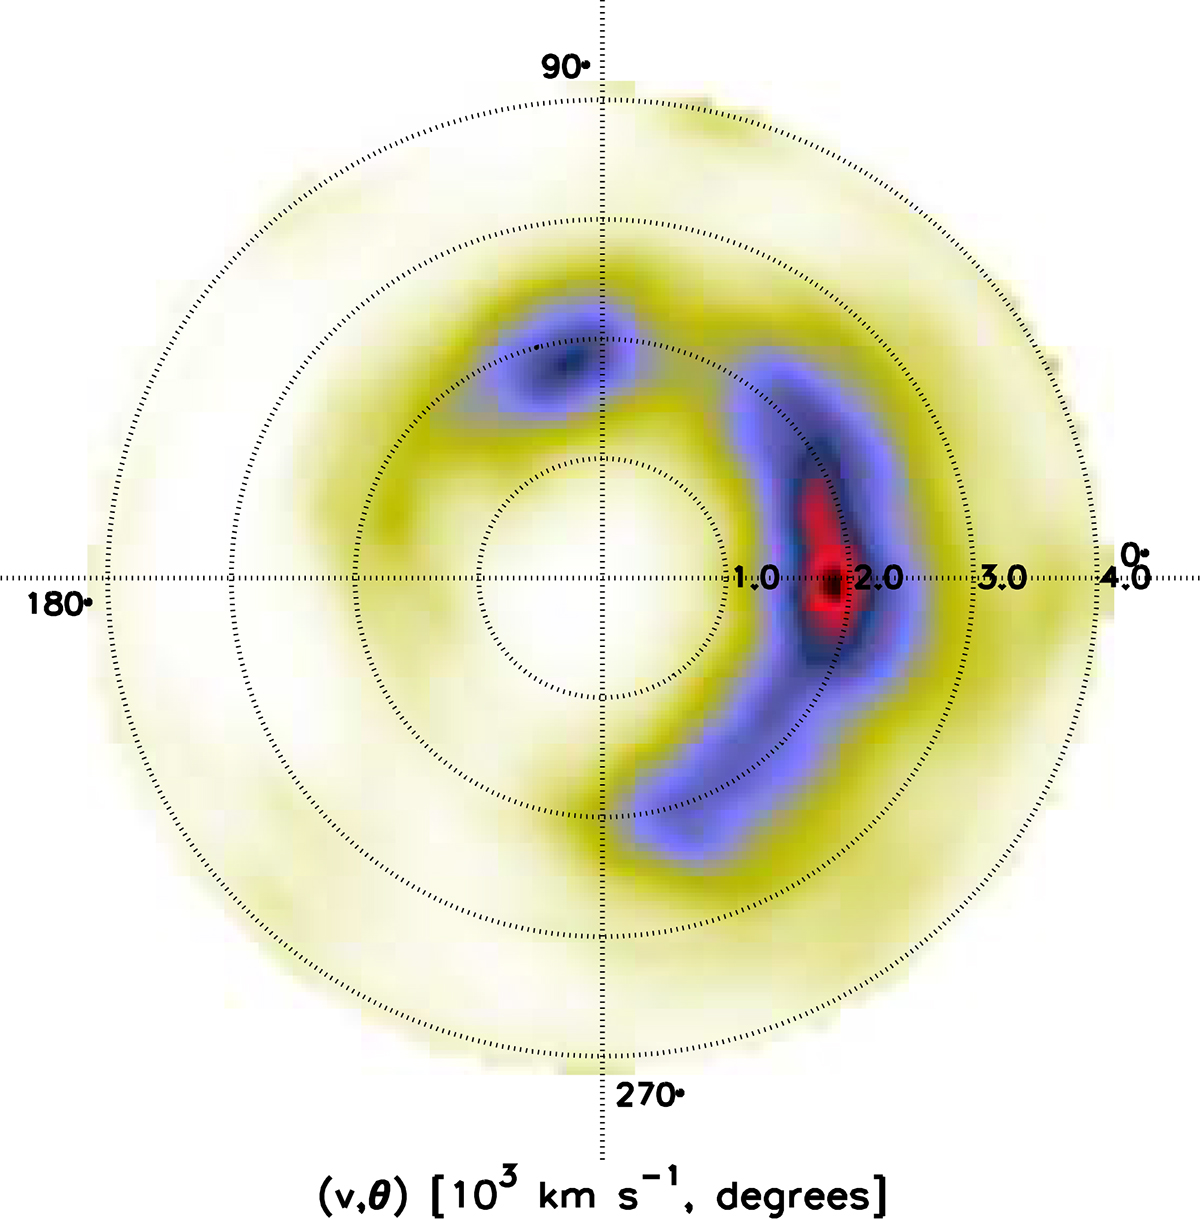
Fig. 11.
Download original image
Doppler tomogram of the Hα emission feature. The minimally assumptive Hα emission density distribution, extrapolated from the emission line variation on the 6.6-minute white dwarf spin period, is shown in the v = Vsin(i) velocity space (i = inclination of the white dwarf rotation axis). The white dwarf is located at the origin at the coordinate system (v, θ). The evolution of the obtained source distribution with rotation phase can be recovered by rotating the coordinate system uniformly and clockwise over one variation cycle. The concentric dotted lines mark regions of constant velocity separated by 1000 km/s from each other, while the colors illustrate the density of emission. The emission distribution resembles a half ring, with velocities ranging between ≈1500 and ≈2500 km/s and peaking at a velocity of ≈1700 km/s.
Current usage metrics show cumulative count of Article Views (full-text article views including HTML views, PDF and ePub downloads, according to the available data) and Abstracts Views on Vision4Press platform.
Data correspond to usage on the plateform after 2015. The current usage metrics is available 48-96 hours after online publication and is updated daily on week days.
Initial download of the metrics may take a while.