Fig. 12.
Download original image
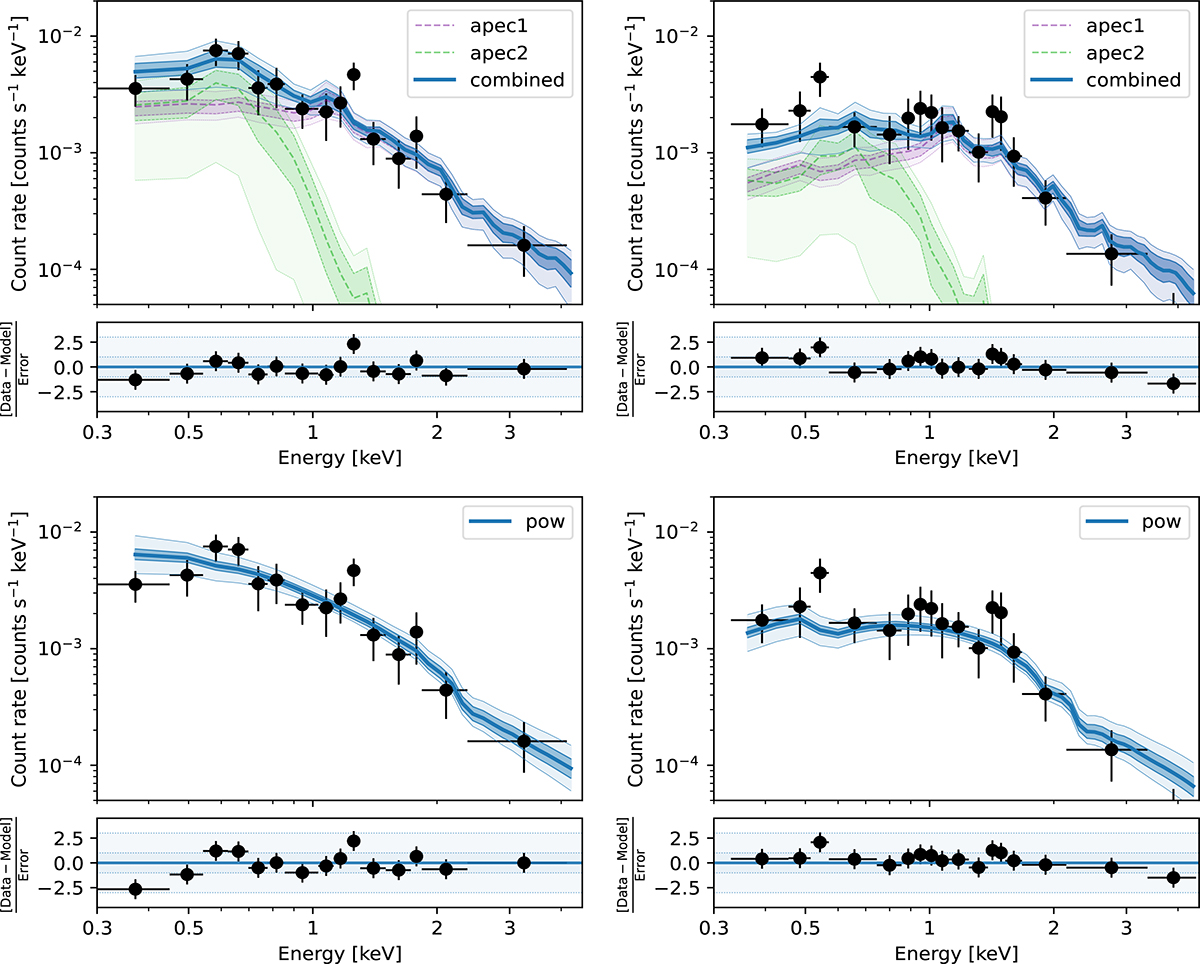
XMM spectral fit. The X-ray spectra are shown as a photon count rate as a function of energy (black data points) for the XMM PN detector (left column) and the combined M1 and M2 detectors (right column). The best fitting two-temperature APEC and power law emission models, convolved with the instrumental response, are shown in blue on the top and bottom rows respectively, with the 3-σ contours shown as shaded regions. In the case of the two-temperature APEC model, the two individual temperature components are shown in green and purple, along with their 3-σ contours. The residuals of the fit models, in both detectors, are shown on the bottom of their respective plots.
Current usage metrics show cumulative count of Article Views (full-text article views including HTML views, PDF and ePub downloads, according to the available data) and Abstracts Views on Vision4Press platform.
Data correspond to usage on the plateform after 2015. The current usage metrics is available 48-96 hours after online publication and is updated daily on week days.
Initial download of the metrics may take a while.