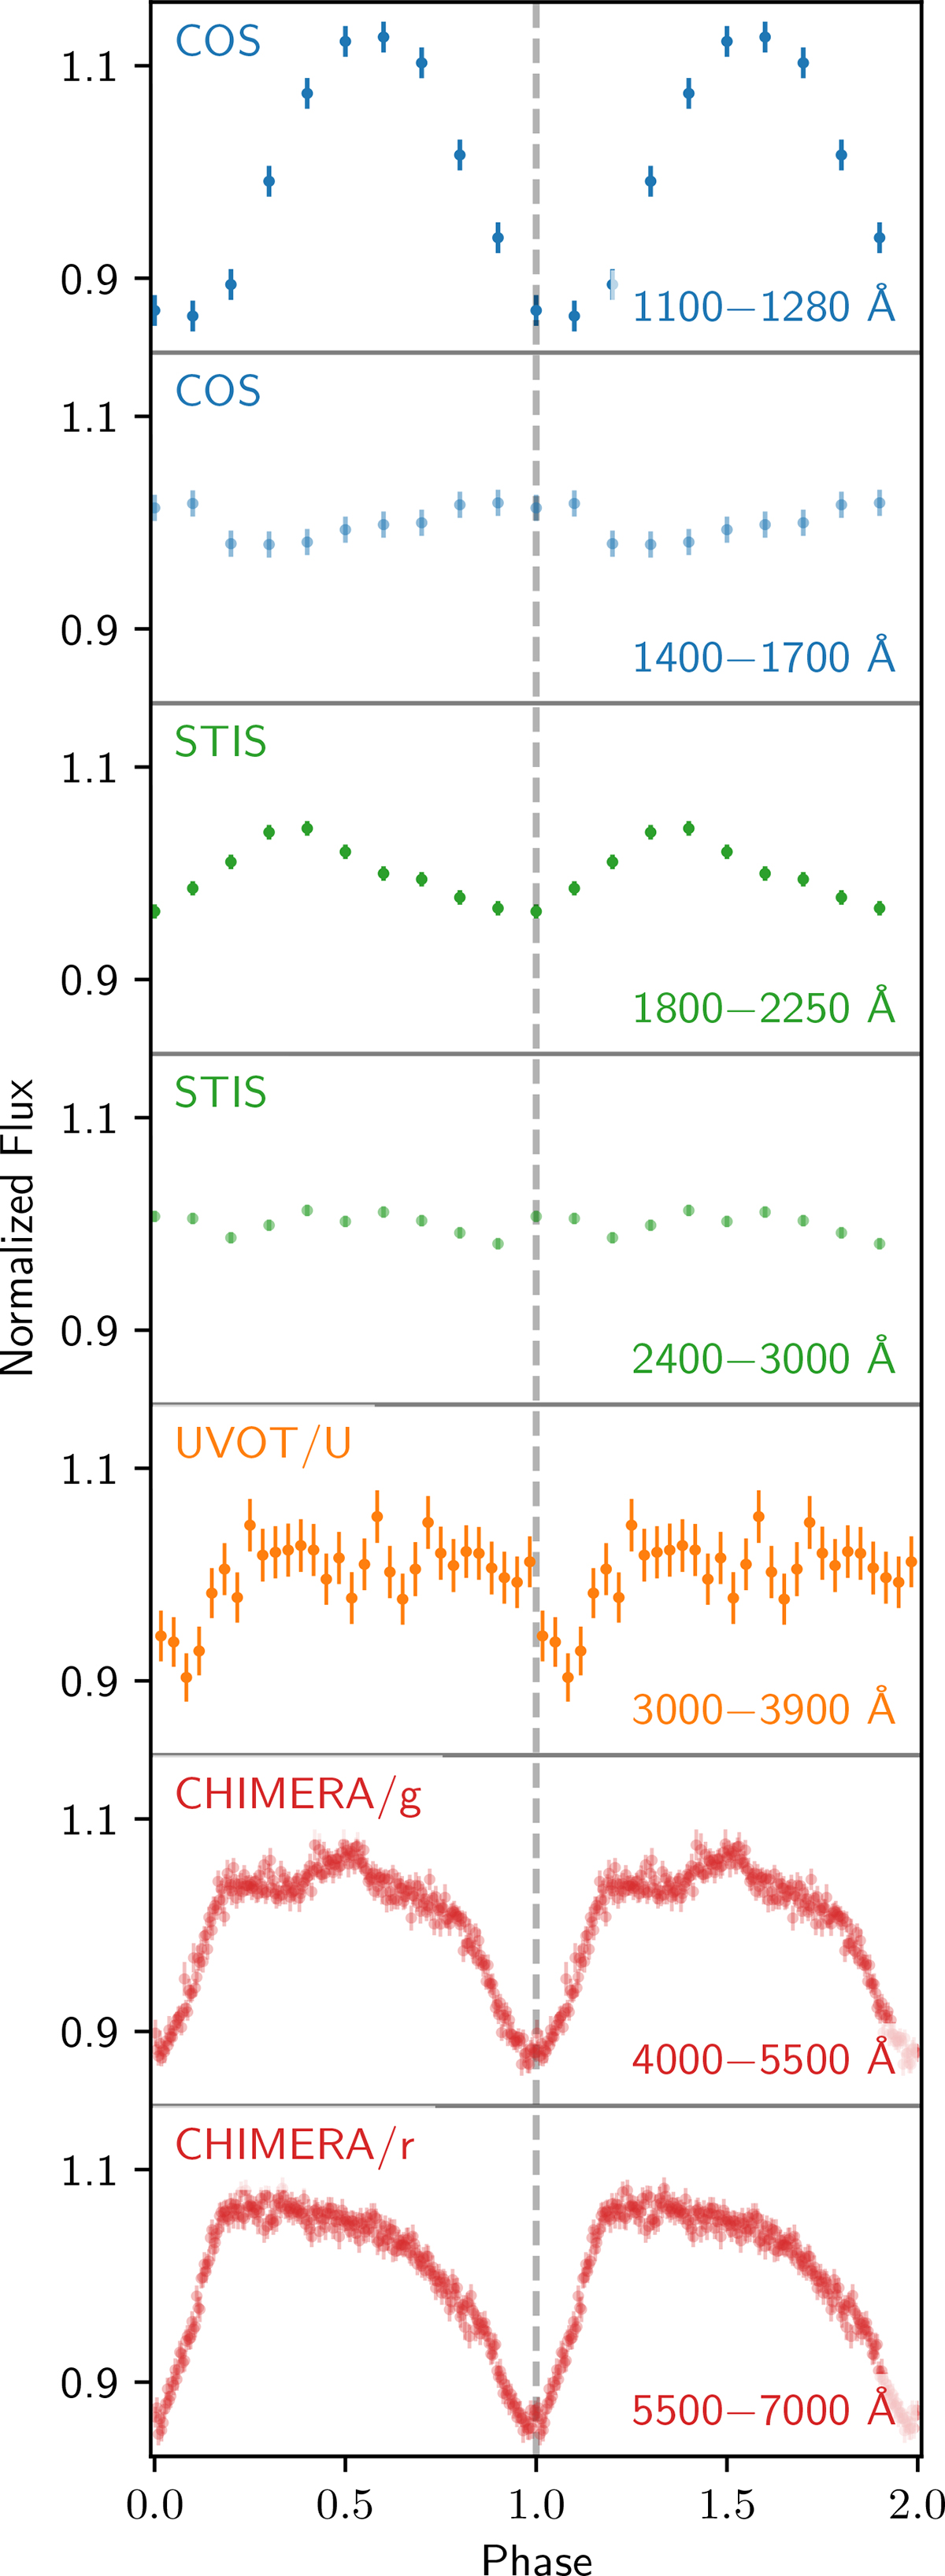
Fig. 16.
Download original image
Optical and UV light curves for ZTF J2008+4449, phased at the correct period for each epoch as derived in Section 3.1. Phase 0 corresponds to the minimum in the r-band. While for the CHIMERA and XMM/UVOT data the filter is indicated in the upper-left corner of each plot, for the STIS and COS data we extracted light curves by averaging the flux in the wavelength range indicated in the bottom right of each plot.
Current usage metrics show cumulative count of Article Views (full-text article views including HTML views, PDF and ePub downloads, according to the available data) and Abstracts Views on Vision4Press platform.
Data correspond to usage on the plateform after 2015. The current usage metrics is available 48-96 hours after online publication and is updated daily on week days.
Initial download of the metrics may take a while.