Open Access
Fig. 18.
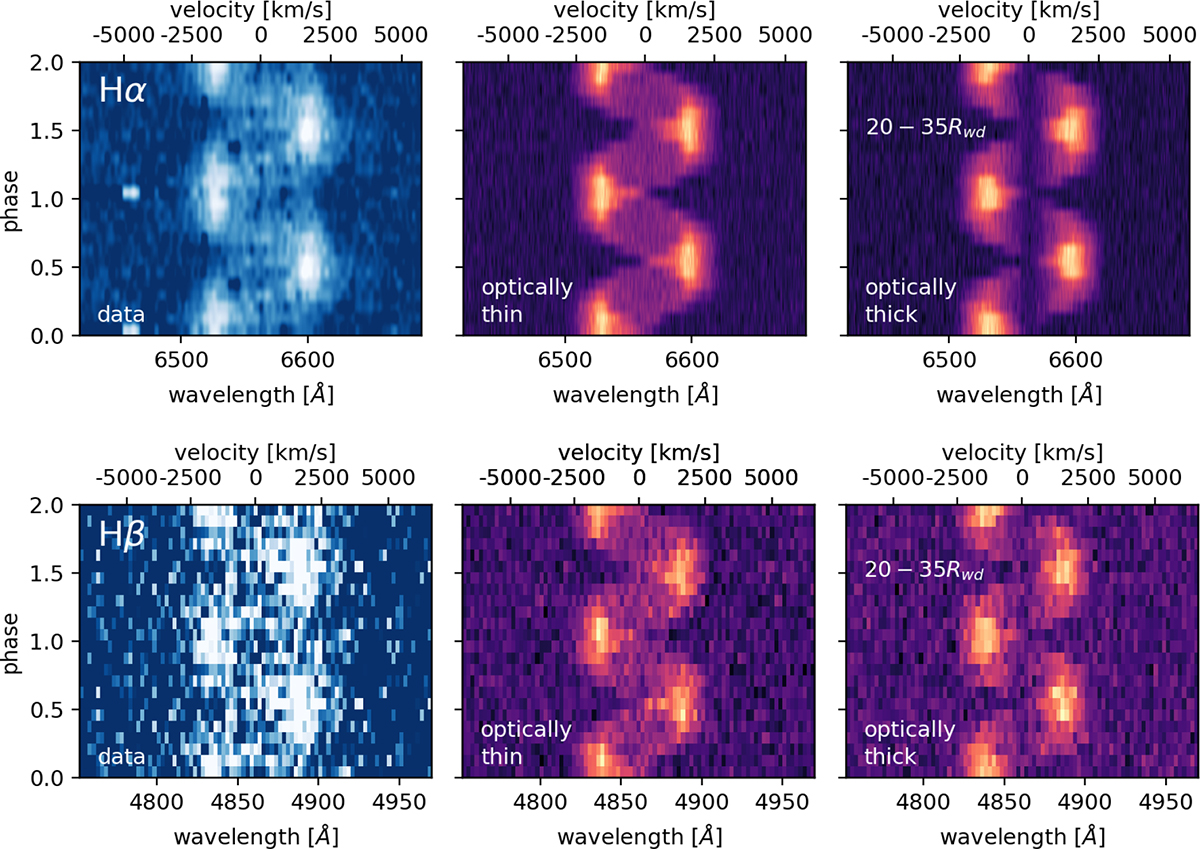
Download original image
Comparison of the trailed spectrogram from LRIS for the Hα and Hβ emission of ZTF J2008+4449 (upper-left and lower-left plots, respectively, in blue) with our model for the optically thin (central plots) and optically thick (right plots) emission from a half ring with Rin = 20RWD and Rout = 35RWD.
Current usage metrics show cumulative count of Article Views (full-text article views including HTML views, PDF and ePub downloads, according to the available data) and Abstracts Views on Vision4Press platform.
Data correspond to usage on the plateform after 2015. The current usage metrics is available 48-96 hours after online publication and is updated daily on week days.
Initial download of the metrics may take a while.