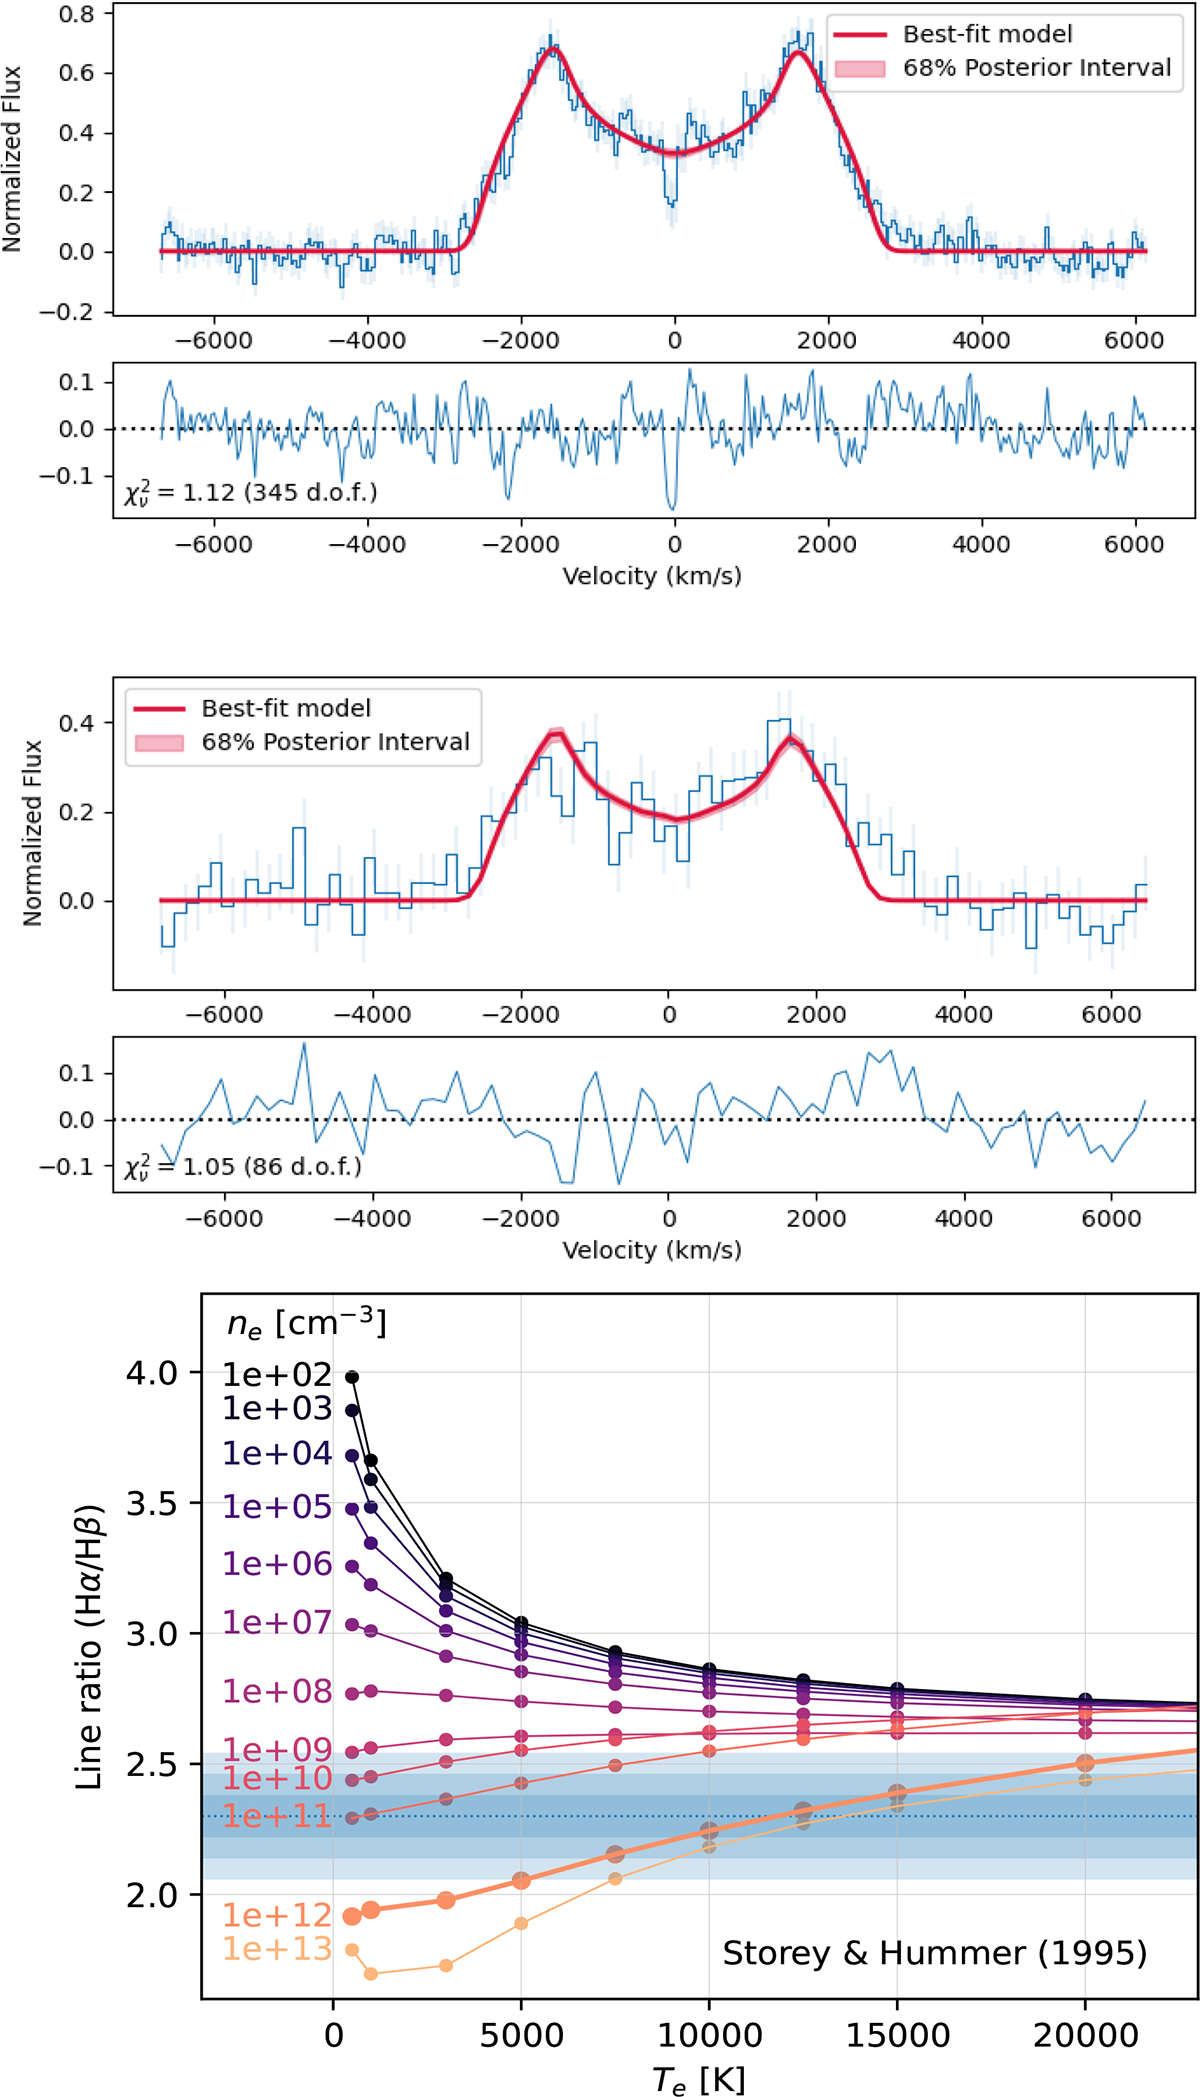
Fig. 20.
Download original image
Top: Five-parameter fit to the Hα emission profile employing our half-ring model and a mix of optically thick and optically thin emission, same as right-middle and right-bottom panels of Fig. C.2. The upper panel shows the comparison of our model (in red) to the phase-resolved Hα profile observed with LRIS for ZTF J2008+4449 (in blue), while the lower panel shows the residuals. Middle: One-parameter fit to the Hβ emission profile for ZTF J2008+4449, fixing all parameters to those found for Hα (see Fig. D.4), except the normalization, which is the only fit parameter. Bottom: Line ratios of Hα/Hβ as presented by Storey & Hummer (1995) for a range of gas temperatures and electron densities, shown with points and connecting lines. The measured Hα/Hβ ratio from the emission line fitting (top two panels) is shown with the horizontal dotted blue line. The 1-, 2-, and 3-σ contours are shown in the filled horizontal bands. The simulation data (points and connected lines) most closely matching the inferred electron density from our photoionization ring model are plotted with greater thickness.
Current usage metrics show cumulative count of Article Views (full-text article views including HTML views, PDF and ePub downloads, according to the available data) and Abstracts Views on Vision4Press platform.
Data correspond to usage on the plateform after 2015. The current usage metrics is available 48-96 hours after online publication and is updated daily on week days.
Initial download of the metrics may take a while.