Fig. 21.
Download original image
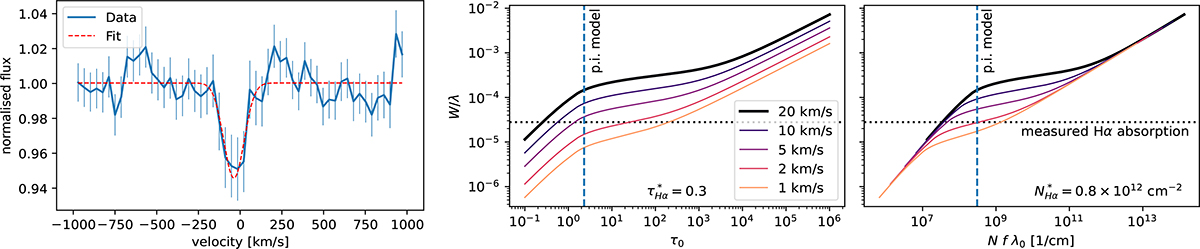
Left: Continuum-normalized spectrum near the rest wavelength of Hα. Before the continuum normalization, the fit emission feature (Fig. C.2) was subtracted. The dashed line shows a Gaussian fit to the data. The fitting procedure yields an equivalent width of EW = 8.4 ± 2.5 km s−1 and central velocity of v0 = −37 ± 13 km s−1. Middle and right: Curves of growth for Hα. Middle: Evolution of the equivalent width as a function of optical depth. Right: Similar to middle panel, but as a function of column density. The dotted horizontal line indicates the measured equivalent width from the left panel. The vertical dashed line indicates the optical depth and column density inferred from the photoionization model.
Current usage metrics show cumulative count of Article Views (full-text article views including HTML views, PDF and ePub downloads, according to the available data) and Abstracts Views on Vision4Press platform.
Data correspond to usage on the plateform after 2015. The current usage metrics is available 48-96 hours after online publication and is updated daily on week days.
Initial download of the metrics may take a while.