Fig. C.2.
Download original image
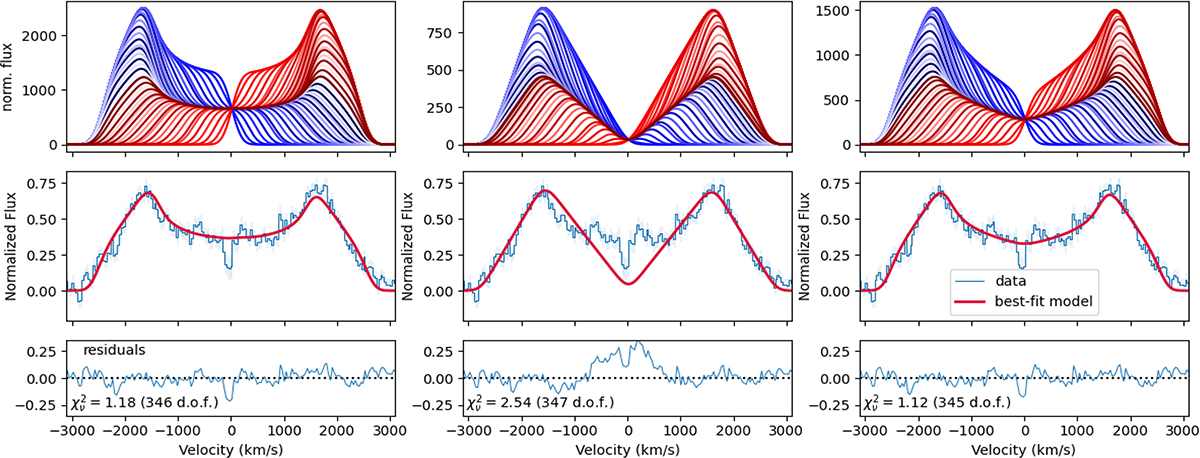
Fit of our toy model for an half ring to the phase-averaged Hα profile for ZTF J2008+4449. The left plots are for optically thin emission, the middle are for optically thick and the right ones are for a mix of optically thin and optically thick emission. The upper panels show the phase-resolved profiles for each model, the middle panels show the best fit phase-averaged compared to the data and the lower panels show the residuals and the reduced χ2 for each fit. It can be seen that the mixed model is a marginally better fit to the data than the optically thin model, and both are much better fits than the fully optically thick model.
Current usage metrics show cumulative count of Article Views (full-text article views including HTML views, PDF and ePub downloads, according to the available data) and Abstracts Views on Vision4Press platform.
Data correspond to usage on the plateform after 2015. The current usage metrics is available 48-96 hours after online publication and is updated daily on week days.
Initial download of the metrics may take a while.