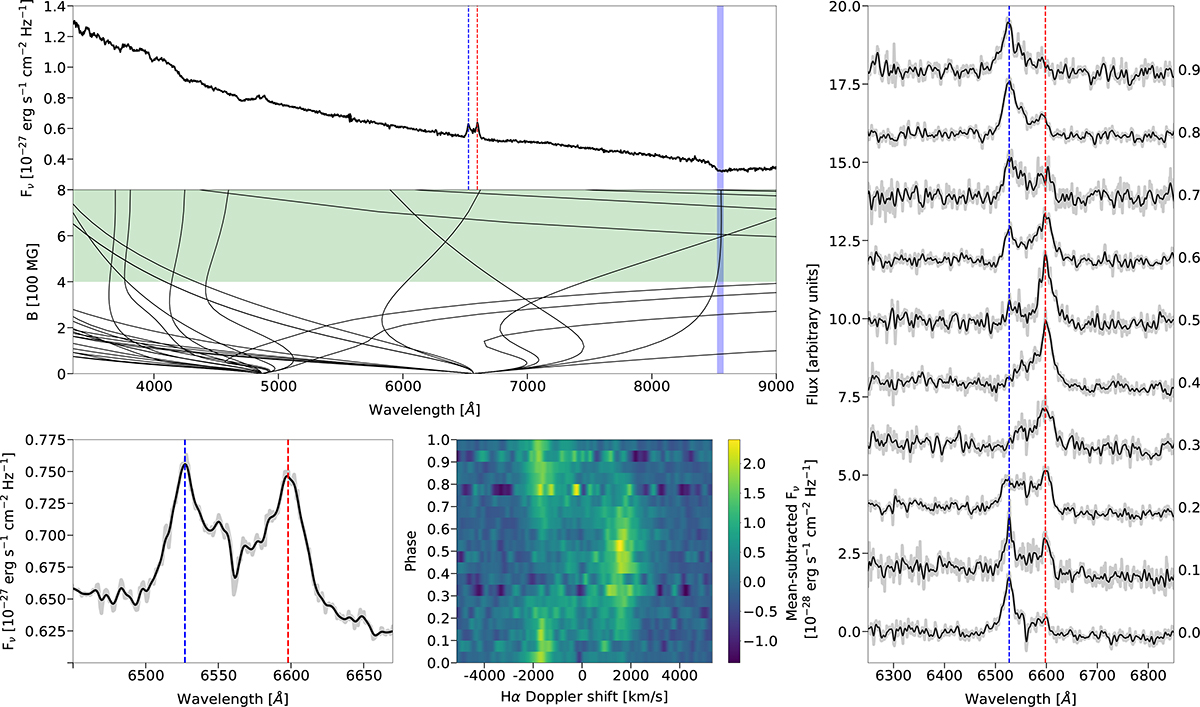
Fig. 3.
Download original image
Top left: Phase-averaged Keck/LRIS spectrum of ZTF J2008+4449 and (below) the predicted positions of Hα and Hβ absorption lines as a function of magnetic field. The broad and shallow absorption lines, in particular at ≈8500 Å marked in blue, indicate a surface magnetic field B > 400 MG, while the Balmer emission lines suggest ongoing accretion. The red and blue dashed lines mark the maximal Doppler shifted wavelengths of Hα and have the same significance in all panels in this plot. Bottom left: Enlarged view of the phase-averaged Hα emission line, binned (unbinned) according to the instrument resolution shown as the solid black (faded gray) line. Bottom middle: Phase evolution of the trailed spectrum around Hα over the 6.6-minute period. The heat map reflects the mean-subtracted flux. Right: Trailed spectra of the Hα line, with spin phase progressing from bottom to top, as denoted by the numbers on the right hand side of the plot.
Current usage metrics show cumulative count of Article Views (full-text article views including HTML views, PDF and ePub downloads, according to the available data) and Abstracts Views on Vision4Press platform.
Data correspond to usage on the plateform after 2015. The current usage metrics is available 48-96 hours after online publication and is updated daily on week days.
Initial download of the metrics may take a while.