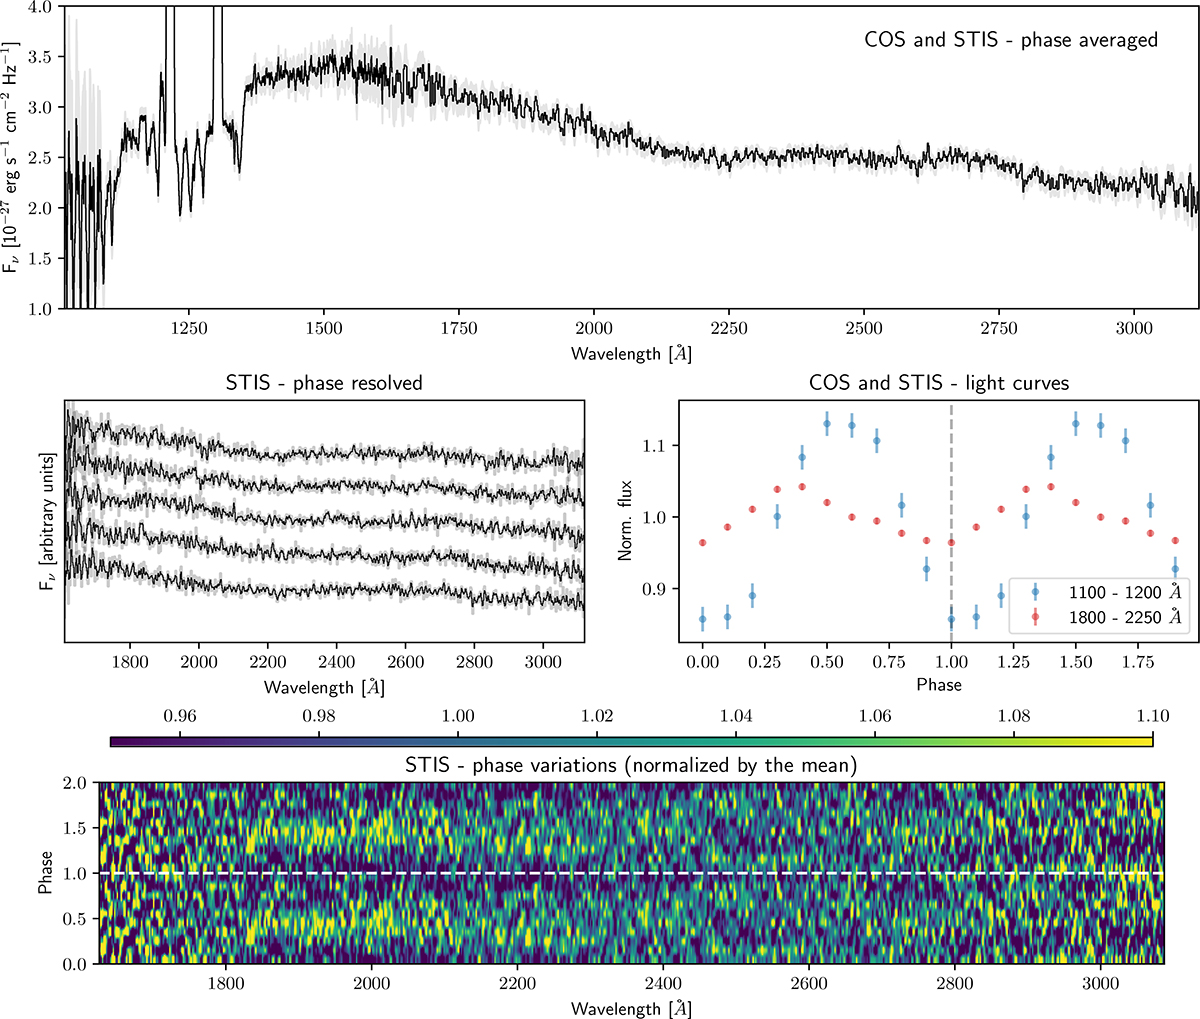
Fig. 5.
Download original image
Data of STIS and COS UV for ZTF J2008+4449. Upper panel: Full phase-averaged UV spectrum in Fν (black solid line, errors in gray). Middle left: Phase-resolved spectrum (five phase bins) in the STIS band over one period. Each phase is shifted vertically by the same amount. There is very little variability with phase in the STIS band. Middle right: Comparison between the COS light curve in the 1100−1200 Å range (blue, same as Fig. 4) and the STIS light curve in the 1800−2250 Å range (red), which is where the STIS spectrum is most variable. The STIS light curve is also roughly sinusoidal, with a lower amplitude than the COS one, and slightly out of phase. Note that the error bars on the STIS light curve are smaller than the symbols used to plot it here. Bottom panel: STIS phase resolved spectra plotted over two periods and divided by the phase-averaged spectrum (the color bar shows the variation with respect to the mean). A weak variability can be observed, mostly in the 1800−2250 Å range.
Current usage metrics show cumulative count of Article Views (full-text article views including HTML views, PDF and ePub downloads, according to the available data) and Abstracts Views on Vision4Press platform.
Data correspond to usage on the plateform after 2015. The current usage metrics is available 48-96 hours after online publication and is updated daily on week days.
Initial download of the metrics may take a while.