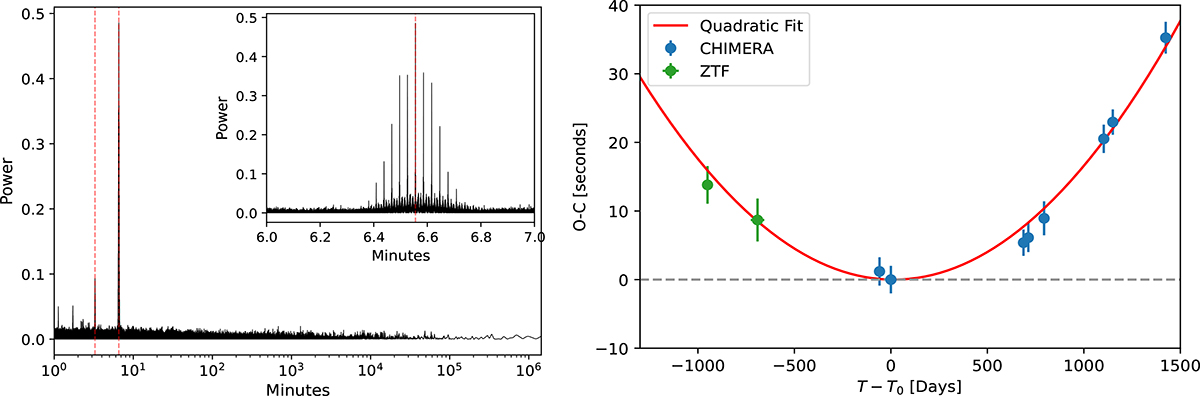
Fig. 7.
Download original image
Left: ZTF periodogram for ZTF J2008+4449 in the r-band. The main period and first harmonic (half of the period) are highlighted by vertical red dashed lines. The inset shows the complex structure of the main peak, due to a combination of the light curve windowing function and the fact that the period is changing significantly over the ZTF baseline. Right: O–C diagram for ZTF J2008+4449 for two high cadence ZTF observations (in green) and the 8 CHIMERA observations (in blue), all in the r band. On the y-axis, we plot the difference in seconds between the observed time of the minimum in the light curve and the expected time calculated assuming a constant period, while on the x-axis, we plot the elapsed time since our reference time T0 = 59401.76. For the second ZTF observation, the error in the x direction indicates the total duration of the ZTF data used in the fit (70 nights); for the other ones the duration is too small to show (three nights for the first ZTF observation, less than one night for the CHIMERA ones). The quadratic behavior indicates the presence of a significant period derivative.
Current usage metrics show cumulative count of Article Views (full-text article views including HTML views, PDF and ePub downloads, according to the available data) and Abstracts Views on Vision4Press platform.
Data correspond to usage on the plateform after 2015. The current usage metrics is available 48-96 hours after online publication and is updated daily on week days.
Initial download of the metrics may take a while.