Fig. 8.
Download original image
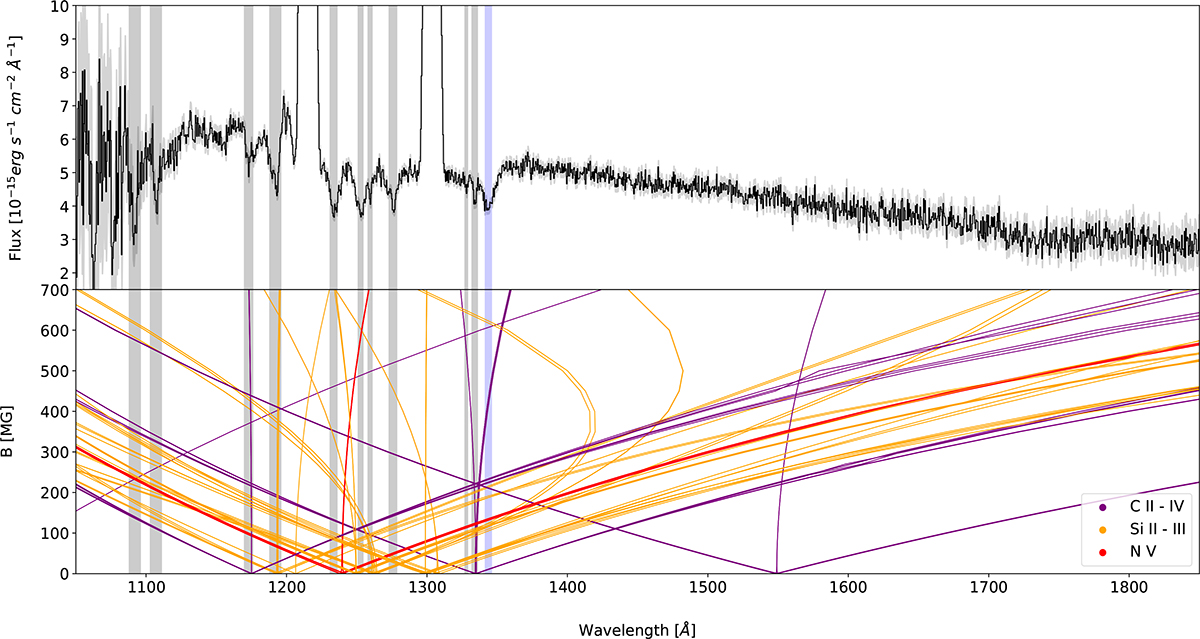
Top: Phase-averaged COS spectrum in Fλ (in black), with errors in light gray. The vertical bands in both panels mark the position of the absorption lines, with the blue one corresponding to the absorption line at 1344 Å, as in the top panel of Fig. 4; Bottom: Positions of a suite of C II–IV (black), Si II–III (purple), and N V (red) ionic transition components as a function of magnetic field strengths. Only transitions with a relatively large oscillator strength at 500 MG have been plotted. It can be seen that the π components of the Zeeman-split lines do not deviate far from the wavelength range where most of the absorption lines in the UV spectrum are located.
Current usage metrics show cumulative count of Article Views (full-text article views including HTML views, PDF and ePub downloads, according to the available data) and Abstracts Views on Vision4Press platform.
Data correspond to usage on the plateform after 2015. The current usage metrics is available 48-96 hours after online publication and is updated daily on week days.
Initial download of the metrics may take a while.